



Find the best tutors and institutes for Class 10 Tuition
Q1:
The following table shows the ages of the patients admitted in a hospital during a year:
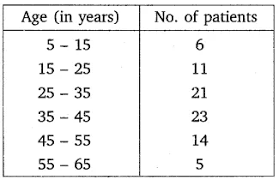
Find the mode and the mean of the data given above. Compare and interpret the two measures of central tendency.
The following table shows the ages of the patients admitted in a hospital during a year:
Find the mode and the mean of the data given above. Compare and interpret the two measures of central tendency.
Solution :
Given: The frequency distribution of ages of patients admitted to a hospital:
| Age (in years) | 5-15 | 15-25 | 25-35 | 35-45 | 45-55 | 55-65 |
|---|---|---|---|---|---|---|
| Number of patients ($f_i$) | 6 | 11 | 21 | 23 | 14 | 5 |
To Find: The Mode and the Mean of the given data, and to compare and interpret the results.
Part 1: Calculation of Mode
Formula: $\text{Mode} = l + \left( \frac{f_1 - f_0}{2f_1 - f_0 - f_2} \right) \times h$
Where:
- $l$ = lower limit of the modal class
- $h$ = size of the class interval
- $f_1$ = frequency of the modal class
- $f_0$ = frequency of the class preceding the modal class
- $f_2$ = frequency of the class succeeding the modal class
Step 1.1: Identify the Modal Class. The maximum frequency is $23$, which corresponds to the class interval $35-45$. Thus, the modal class is $35-45$.
Step 1.2: Assign values. $l = 35$, $f_1 = 23$, $f_0 = 21$, $f_2 = 14$, $h = 10$.
Step 1.3: Substitute into the formula.
$\text{Mode} = 35 + \left( \frac{23 - 21}{2(23) - 21 - 14} \right) \times 10$
$\text{Mode} = 35 + \left( \frac{2}{46 - 35} \right) \times 10 = 35 + \left( \frac{2}{11} \right) \times 10 = 35 + \frac{20}{11} \approx 35 + 1.818 = 36.82$
Part 2: Calculation of Mean
Step 2.1: Prepare the table for Assumed Mean Method ($A = 40$).
| Age | $f_i$ | Class Mark ($x_i$) | $d_i = x_i - 40$ | $f_i d_i$ |
|---|---|---|---|---|
| 5-15 | 6 | 10 | -30 | -180 |
| 15-25 | 11 | 20 | -20 | -220 |
| 25-35 | 21 | 30 | -10 | -210 |
| 35-45 | 23 | 40 | 0 | 0 |
| 45-55 | 14 | 50 | 10 | 140 |
| 55-65 | 5 | 60 | 20 | 100 |
| Total | 80 | - | - | -370 |
Step 2.2: Apply the Mean formula.
$\text{Mean} (\bar{x}) = A + \frac{\sum f_i d_i}{\sum f_i} = 40 + \left( \frac{-370}{80} \right) = 40 - 4.625 = 35.375$
Part 3: Comparison and Interpretation
The modal age is approximately $36.82$ years, representing the age group with the highest number of patients admitted. The mean age is $35.38$ years, representing the average age of all patients admitted. Since the mean is slightly less than the mode, it indicates that the distribution is slightly negatively skewed, but both measures suggest that the majority of patients admitted are in the mid-30s age range.
Final Answer: The Mode is 36.82 years and the Mean is 35.38 years.
More Questions from Class 10 Mathematics Statistics EXERCISE 13.2
- Q2: The following data gives the information on the observed lifetimes (in hours) of 225 electrical components : Determine the modal lifetimes of the components.
- Q3: The following data gives the distribution of total monthly household expenditure of 200 families of a village. Find the modal monthly expenditure of the families. Also, find the mean monthly expenditure :
- Q4: The following distribution gives the state-wise teacher-student ratio in higher secondary schools of India. Find the mode and mean of this data. Interpret the two measures.
- Q5: The given distribution shows the number of runs scored by some top batsmen of the world in one-day international cricket matches. Find the mode of the data.
- Q6: A student noted the number of cars passing through a spot on a road for 100 periods each of 3 minutes and summarised it in the table given below. Find the mode of the data:
CBSE Solutions for Class 10 Mathematics Statistics
Chapters in CBSE - Class 10 Mathematics
Top Tutors who teach Statistics
 Top Tutor
 Vimanapura Krishna Nagar, Bangalore
 6 yrs of
Exp
6 yrs of
Exp
 3 students
 666 hrs of classes completed
 600
per hour
600
per hour
 Online Classes
 Student's Home
In this competitive world education is the most important tool rather I say that it is sword by which one can win the competition.so I am in this field from last four years and teaching is my passion and even strength.My students are very happy with me in college as well as in tutions. Their results show it all. Students are always been encouraged to do studies one should not force them for the same.
 Top Tutor
Sb Colony, Eluru
8 yrs of
Exp
2 students
42 hrs of classes completed
600
per hour
Online Classes
Student's Home
Top Tutor
Sb Colony, Eluru
8 yrs of
Exp
2 students
42 hrs of classes completed
600
per hour
Online Classes
Student's Home
 Tutor's home
I have taught students at Samarthanam and NGO for challenged students from class 1-XII in Bangalore for about 2 years. I used to teach students of groups 3-10 every weekend. I helped students with their home work as well as clarify concepts thought in the classroom. I saw improvement in student performance over the course of time with the my teaching methods
An exceptional teacher who genuinely cares! Sir assessed my son’s weak areas in coordinate geometry and tailored his lessons perfectly. The easy explanation style built strong fundamentals, helping my son boost his term score from 50% to an unbelievable 88%
 Super Tutor
Kodambakkam, Chennai
15 yrs of
Exp
57 students
4127 hrs of classes completed
800
per hour
Online Classes
Super Tutor
Kodambakkam, Chennai
15 yrs of
Exp
57 students
4127 hrs of classes completed
800
per hour
Online Classes
With a decade of experience in teaching mathematics, physics, and chemistry for students from grades 8 through 12 across CBSE, IB, and ICSE boards, I offer a comprehensive educational approach that caters to a diverse range of curricula and learning needs. My academic background includes a BE and an MBA, equipping me with both technical and managerial skills that enhance my teaching methodology. Throughout my career, I have specialized in home tutoring, where I have developed a personalized approach to education that focuses on each student's unique needs and strengths. My sessions are designed to be interactive and engaging, fostering a learning environment where students feel supported and motivated. I conduct both online and offline classes, each lasting one hour, and utilize a variety of teaching tools to facilitate learning. I employ a whiteboard to visually explain concepts and provide question papers to help students practice and prepare for their exams. This hands-on approach ensures that students not only understand theoretical concepts but also develop problem-solving skills and confidence in their subjects. My commitment to delivering high-quality education and my extensive experience make me well-suited to guide students through their academic journey, helping them achieve their full potential in mathematics, physics, and chemistry.


 Top Tutor
Gharoli Gharoli, Delhi
17 yrs of
Exp
2 students
122 hrs of classes completed
400
per hour
Online Classes
Top Tutor
Gharoli Gharoli, Delhi
17 yrs of
Exp
2 students
122 hrs of classes completed
400
per hour
Online Classes
I bring with me 17 years of diverse experience in the pharmaceutical industry along with academic expertise, combining strong practical knowledge with a passion for teaching. I am dedicated to simplifying complex concepts and delivering them in an engaging manner, ensuring that students not only gain subject knowledge but also develop the skills, confidence, and potential required to achieve academic excellence and become industry-ready professionals.
Very friendly teacher and explain very well and explain in detail overall teacher is very good and friendly.
 Top Tutor
Kazipet, Warangal
2 yrs of
Exp
1 student
50 hrs of classes completed
Online Classes
Student's Home
Tutor's home
Top Tutor
Kazipet, Warangal
2 yrs of
Exp
1 student
50 hrs of classes completed
Online Classes
Student's Home
Tutor's home
I have 5years of teaching experience where I implement Inductive ,Deductive teaching techinques in mathematics. I begin the teaching concepts of maths with basic level to high level which ensures the teaching learning process occurs even a below average student I make special work sheets for the brain nutrient students and also to the below average students ,so that helps students to become learn individually according to their level. In teaching maths concepts regarding Geometry , Trignometry and Areas and Circles here I use the concrete to semi concrete from thier i take them to abstract so child can easily familiar to the concept, teaching learning process occurs in a positive way. In teaching maths I use heuristic method which creates an enthusiasm among the students to learn maths subject and it eradicate the fear of maths from the students. As a teacher I teach according to the students taste and their interests, so teaching learning process will be occurred in a meaningful way. I observe the individual difference of the students while teaching, so that I can plan to teach according individual difference of the different students in the classroom. I use remedial class for the slow learners to develop in the subject. In this remedial session I mostly concentrating on the basic of maths subject so children can overcome the previous misunderstanding concepts regarding maths and here it will be taught his doubts regarding subject will be clarified. By teaching maths subject I make students all round development which is very valuable in the life.
Find more Tutor for Statistics in your City
- Bangalore Mathematics Tutors
- Delhi Mathematics Tutors
- Chennai Mathematics Tutors
- Gurgaon Mathematics Tutors
- Noida Mathematics Tutors
- Hyderabad Mathematics Tutors
- Mumbai Mathematics Tutors
- Ghaziabad Mathematics Tutors
- Chandigarh Mathematics Tutors
- Pune Mathematics Tutors
- Jaipur Mathematics Tutors
- Surat Mathematics Tutors



