



Find the best tutors and institutes for Class 10 Tuition
Q5:
In a retail market, fruit vendors were selling mangoes kept in packing boxes. These boxes contained varying number of mangoes. The following was the distribution of mangoes according to the number of boxes.
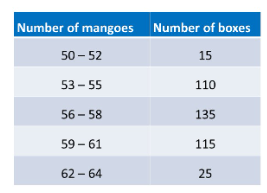
Find the mean number of mangoes kept in a packing box. Which method of finding the mean did you choose?
In a retail market, fruit vendors were selling mangoes kept in packing boxes. These boxes contained varying number of mangoes. The following was the distribution of mangoes according to the number of boxes.
Find the mean number of mangoes kept in a packing box. Which method of finding the mean did you choose?
Solution :
Given: The frequency distribution of mangoes in packing boxes is as follows:
| Number of Mangoes | 50-52 | 53-55 | 56-58 | 59-61 | 62-64 |
|---|---|---|---|---|---|
| Number of Boxes ($f_i$) | 15 | 110 | 135 | 115 | 25 |
To Find: The mean number of mangoes kept in a packing box. We will use the Step-Deviation Method as it simplifies calculations when class intervals are continuous and frequencies are large.
Step 1: Prepare the Frequency Distribution Table
First, we observe that the class intervals are not continuous (e.g., 52 to 53). We adjust them by subtracting 0.5 from the lower limit and adding 0.5 to the upper limit. Then, we calculate the class mark ($x_i$) for each interval using the formula: $x_i = \frac{\text{Lower Limit} + \text{Upper Limit}}{2}$.
| Class Interval | $f_i$ | $x_i$ | $d_i = x_i - a$ | $u_i = \frac{x_i - a}{h}$ | $f_i u_i$ |
|---|---|---|---|---|---|
| 49.5-52.5 | 15 | 51 | -6 | -2 | -30 |
| 52.5-55.5 | 110 | 54 | -3 | -1 | -110 |
| 55.5-58.5 | 135 | 57 (a) | 0 | 0 | 0 |
| 58.5-61.5 | 115 | 60 | 3 | 1 | 115 |
| 61.5-64.5 | 25 | 63 | 6 | 2 | 50 |
| Total | $\sum f_i = 400$ | - | - | - | $\sum f_i u_i = 25$ |
Step 2: Identify Variables for Step-Deviation Method
Let the assumed mean ($a$) = $57$.
The class size ($h$) = $52.5 - 49.5 = 3$.
Sum of frequencies ($\sum f_i$) = $400$.
Sum of product of frequencies and deviations ($\sum f_i u_i$) = $25$.
Step 3: Apply the Mean Formula
The formula for the mean ($\bar{x}$) using the Step-Deviation Method is:
$\bar{x} = a + \left( \frac{\sum f_i u_i}{\sum f_i} \right) \times h$
Substituting the values:
$\bar{x} = 57 + \left( \frac{25}{400} \right) \times 3$
Step 4: Perform Arithmetic Calculations
$\bar{x} = 57 + \left( \frac{1}{16} \right) \times 3$ [Since $25/400 = 1/16$]
$\bar{x} = 57 + \frac{3}{16}$
$\bar{x} = 57 + 0.1875$
$\bar{x} = 57.1875$
Conclusion on Method: The Step-Deviation method was chosen because the class intervals are uniform and the values of $f_i$ and $x_i$ are large, making manual multiplication cumbersome. This method reduces the magnitude of the numbers, facilitating easier calculation.
Final Answer: The mean number of mangoes kept in a packing box is 57.19 (rounded to two decimal places).
More Questions from Class 10 Mathematics Statistics EXERCISE 13.1
- Q1: A survey was conducted by a group of students as a part of their environment awareness programme, in which they collected the following data regarding the number of plants in 20 houses in a locality. Find the mean number of plants per house. Which method did you use for finding the mean, and why?
- Q2: Consider the following distribution of daily wages of 50 workers of a factory. Find the mean daily wages of the workers of the factory by using an appropriate method.
- Q3: The following distribution shows the daily pocket allowance of children of a locality. The mean pocket allowance is Rs 18. Find the missing frequency $f$.
- Q4: Thirty women were examined in a hospital by a doctor and the number of heartbeats per minute were recorded and summarised as follows. Find the mean heartbeats per minute for these women, choosing a suitable method.
- Q6: The table below shows the daily expenditure on food of 25 households in a locality. Find the mean daily expenditure on food by a suitable method.
- Q7: To find out the concentration of $SO_2$ in the air (in parts per million, i.e., ppm), the data was collected for 30 localities in a certain city and is presented below: Find the mean concentration of $SO_2$ in the air.
- Q8: A class teacher has the following absentee record of 40 students of a class for the whole term. Find the mean number of days a student was absent.
- Q9: The following table gives the literacy rate (in percentage) of 35 cities. Find the mean literacy rate.
CBSE Solutions for Class 10 Mathematics Statistics
Chapters in CBSE - Class 10 Mathematics
Top Tutors who teach Statistics

 Top Tutor
 Bicholi Mardana Neer Nagar, Indore
 8 yrs of
Exp
8 yrs of
Exp
 12 students
 362 hrs of classes completed
 900
per hour
900
per hour
 Online Classes
I have Taught 3 years in CBSE board and 5 years In ICSE board in class 10 with 100% results.Got an opportunity to go for CBSE board class 10 Maths copy correction.Was Board examiner head for ICSE .
Pragya ma'am is amazing! She helped me with maths a lot! Great teacher!
 Top Tutor
SCB Nagar, Kothagudem
20 yrs of
Exp
33 students
2269 hrs of classes completed
500
per hour
Online Classes
Top Tutor
SCB Nagar, Kothagudem
20 yrs of
Exp
33 students
2269 hrs of classes completed
500
per hour
Online Classes
22 Years Experience in Schools IN ICSE/CBSE/IGCSE IN DIFFERENT STATE BOARDS
Sir is very friendly teacher he will support us more he is the best teacher of the year his teaching skills are really good.


 Super Tutor
BTM 6th Stage, Bangalore
11 yrs of
Exp
11 students
829 hrs of classes completed
600
per hour
Online Classes
Super Tutor
BTM 6th Stage, Bangalore
11 yrs of
Exp
11 students
829 hrs of classes completed
600
per hour
Online Classes
 Student's Home
With over 11 years of teaching experience, I have had the privilege of mentoring more than 5,000 students across various reputed coaching institutes in Bangalore. My teaching has primarily focused on preparing students for competitive exams, and I take pride in the fact that many of my students have successfully qualified for NEET, JEE and CET under my guidance. Throughout my career, I have been committed to delivering clear, concept-driven instruction while fostering a supportive and open classroom environment. I ensure that every student, regardless of their level, feels comfortable asking questions and engaging actively in the learning process. My ability to simplify complex topics and build strong student rapport continues to be the cornerstone of my teaching approach.
He is good. My son is performing well after starting classes with him. He gives mock tests too during exam and that helps even more.


 Top Tutor
Tilak Nagar, Delhi
4 yrs of
Exp
2 students
56 hrs of classes completed
300
per hour
Online Classes
Student's Home
Top Tutor
Tilak Nagar, Delhi
4 yrs of
Exp
2 students
56 hrs of classes completed
300
per hour
Online Classes
Student's Home
 Tutor's home
I am a mathematics expert . I am teaching this subject since a decade . I ve handled thousands of students and bring numerous centum results in past . You will able to learn maths in the most pragmatic approach with me and develop a love for this subject .
 Top Tutor
Arjan Garh, Delhi
8 yrs of
Exp
2 students
31 hrs of classes completed
600
per hour
Online Classes
Student's Home
Tutor's home
Top Tutor
Arjan Garh, Delhi
8 yrs of
Exp
2 students
31 hrs of classes completed
600
per hour
Online Classes
Student's Home
Tutor's home
Depankar sir is a very interactive teacher he makes learning fun and effective.After studying with him for only 6 months I have shown signs of improvement. I would definitely recommend him go everyone
Find more Tutor for Statistics in your City
- Bangalore Mathematics Tutors
- Delhi Mathematics Tutors
- Chennai Mathematics Tutors
- Gurgaon Mathematics Tutors
- Noida Mathematics Tutors
- Hyderabad Mathematics Tutors
- Mumbai Mathematics Tutors
- Ghaziabad Mathematics Tutors
- Chandigarh Mathematics Tutors
- Pune Mathematics Tutors
- Jaipur Mathematics Tutors
- Surat Mathematics Tutors



