UrbanPro
true
default_background

Learn Stock Market Investing from the Best Tutors

  • Affordable fees
  • 1-1 or Group class
  • Flexible Timings
  • Verified Tutors

Search in

Understanding Basic Candlestick Charts

Raju Kosireddy
24/09/2019 0 0

Q: What Is A Candlestick?
Ans:

A candlestick is a type of price chart used that displays

the high, low, open, and closing prices of a security

for a specific period.

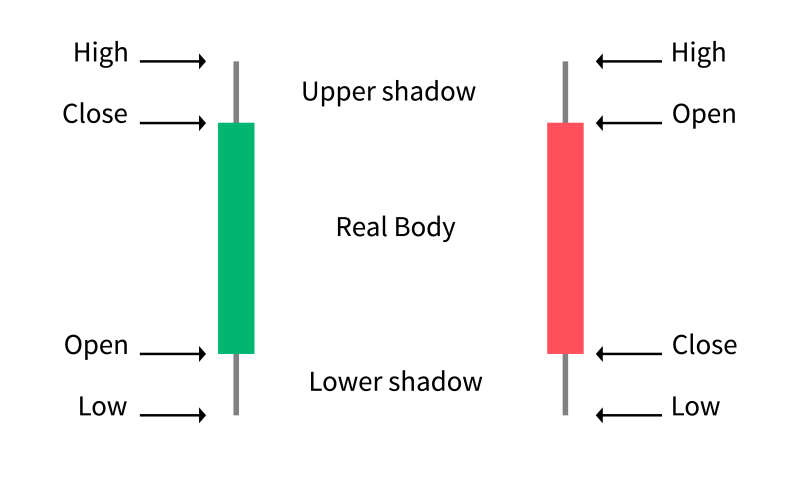
Every candlestick has “Open” “Close” “High” and “Low”

Open: Open represents the opening price of the timeframe, which the candlestick represents.

Close: Close represents the closing price of the timeframe.

High: The highest price movement that was recorded during the timeframe.

Low: The Lowest price movement that was recorded during the timeframe


  • Candlestick charts are used by traders to determine possible price movement based on past patterns.
  • Candlesticks are useful when trading as they show four price points (open, close, high, and low) throughout the period of time the trader specifies.
  • Many algorithms are based on the same price information shown in candlestick charts.
  • Trading is often dictated by emotion, which can be read in candlestick charts.
0 Dislike
Follow 3

Please Enter a comment

Submit

Other Lessons for You

Banknifty Update For Jun-2, 2020
Banknifty opened Gap up @19728 near Gann No 19700 and made a big move. Faced resistance in the zone of 20100 making top @ 20225 and consolidated. It may consolidate for 1-2 days in the range of 20100-19700...
N

Ninad Deshmukh

0 0
0

Is there a complete guide for stock market trading in India?
Yes, there are several resources available that can serve as comprehensive guides for stock market trading in India. Here are a few suggestions: 1. Books: There are numerous books written specifically...

VIX Analysis
The daily VIX chart shows the formation of Doji candles at the bottom and reversal. The daily RSI crossed the previous resistance level of 40. The MACD signal gave bullish crossover suggesting bullish...
N

Ninad Deshmukh

0 0
0

Predict Share Market
How to Predict Share Market As traders, we must still place the corresponding orders to enter and exit positions at the right times and in the right directions in order to profit. Simply understanding...

USD vs Nifty
USD vs Nifty As we know, there is an inverse relationship between USD and Nifty. We can predict where nifty is going. First of all, we need to understand why there is an inverse relationship between USD...

Looking for Stock Market Investing classes?

Learn from Best Tutors on UrbanPro.

Are you a Tutor or Training Institute?

Join UrbanPro Today to find students near you
X

Looking for Stock Market Investing Classes?

The best tutors for Stock Market Investing Classes are on UrbanPro

  • Select the best Tutor
  • Book & Attend a Free Demo
  • Pay and start Learning

Learn Stock Market Investing with the Best Tutors

The best Tutors for Stock Market Investing Classes are on UrbanPro

This website uses cookies

We use cookies to improve user experience. Choose what cookies you allow us to use. You can read more about our Cookie Policy in our Privacy Policy

Accept All
Decline All

UrbanPro.com is India's largest network of most trusted tutors and institutes. Over 55 lakh students rely on UrbanPro.com, to fulfill their learning requirements across 1,000+ categories. Using UrbanPro.com, parents, and students can compare multiple Tutors and Institutes and choose the one that best suits their requirements. More than 7.5 lakh verified Tutors and Institutes are helping millions of students every day and growing their tutoring business on UrbanPro.com. Whether you are looking for a tutor to learn mathematics, a German language trainer to brush up your German language skills or an institute to upgrade your IT skills, we have got the best selection of Tutors and Training Institutes for you. Read more