UrbanPro
true
default_background

Learn Stock Market Trading from the Best Tutors

  • Affordable fees
  • 1-1 or Group class
  • Flexible Timings
  • Verified Tutors

Search in

BankNifty Update Jun-4, 2020

N
Ninad Deshmukh
04/06/2020 0 0

After making Gap up opening and sharp upmove towards our target of 21300, Banknifty moved much higher to 21619 but reversed very sharply in last hour closing @ 20940. 

 
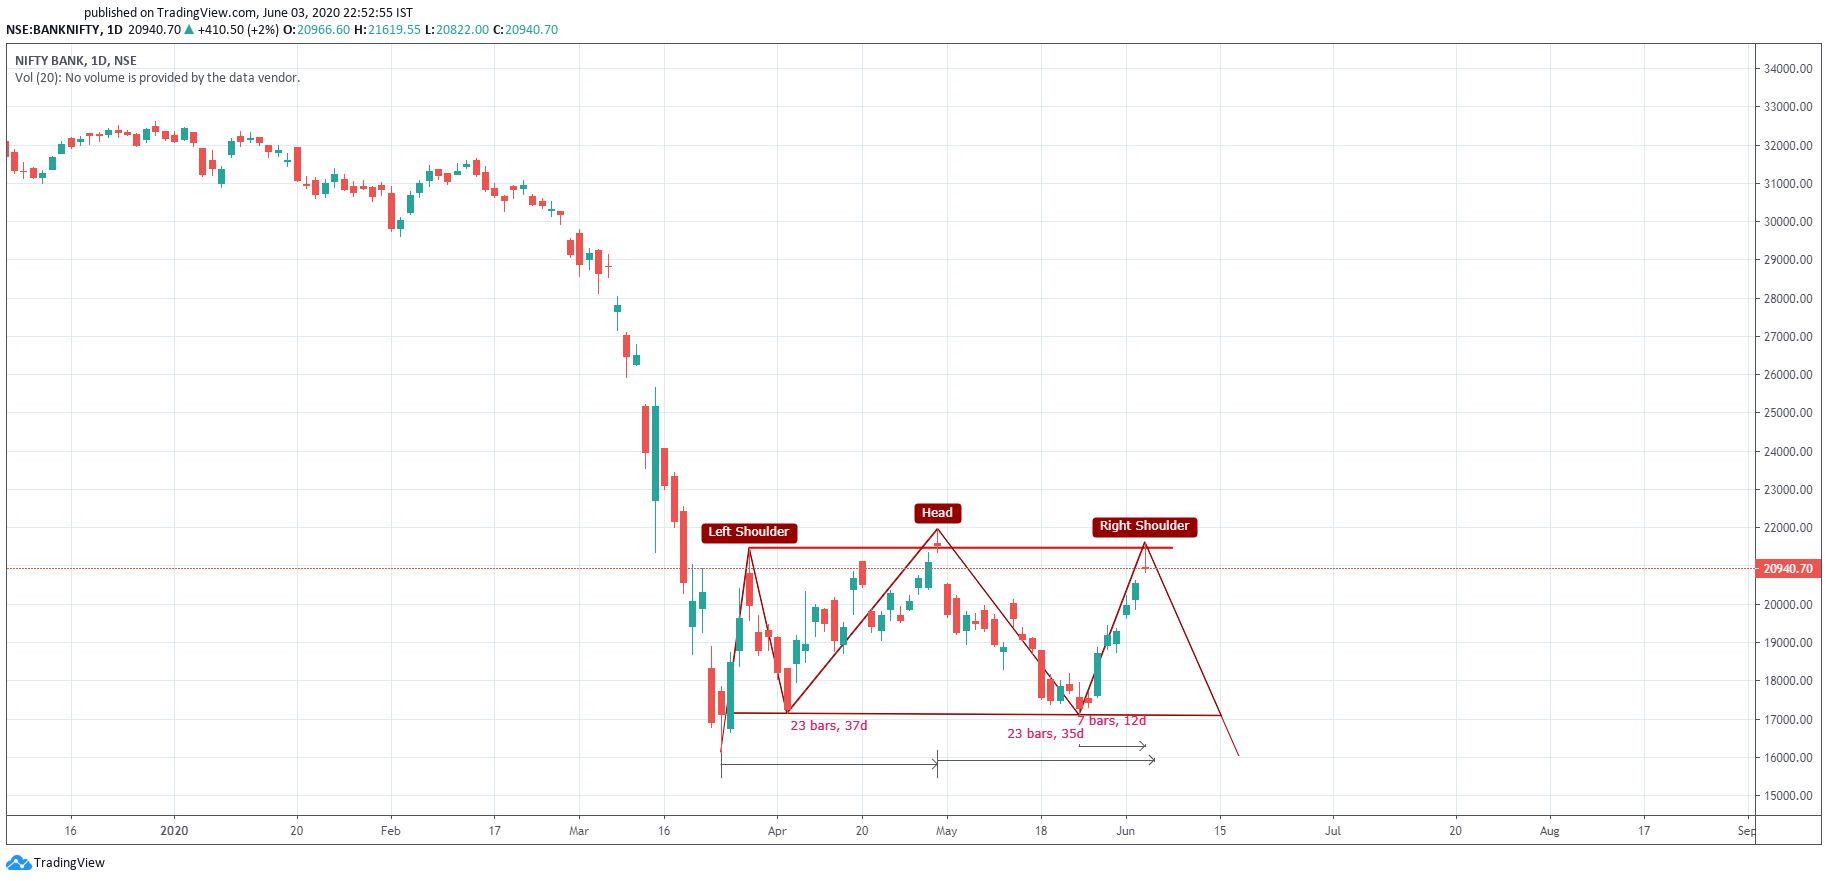
As I mentioned in yesterday's post-Jun-3/Jun-4 are significant dates. If we take a look at today's candle, it very much resembles the reversal candle made on Apr-30. It reversed from the resistance zone of  Mar-27 and Apr-30 tops. It also shows the possibility of the H&S pattern if Apr-30 high is not taken out. Tomorrow's session is important (Jun-4) can set the tone for the next move.
 
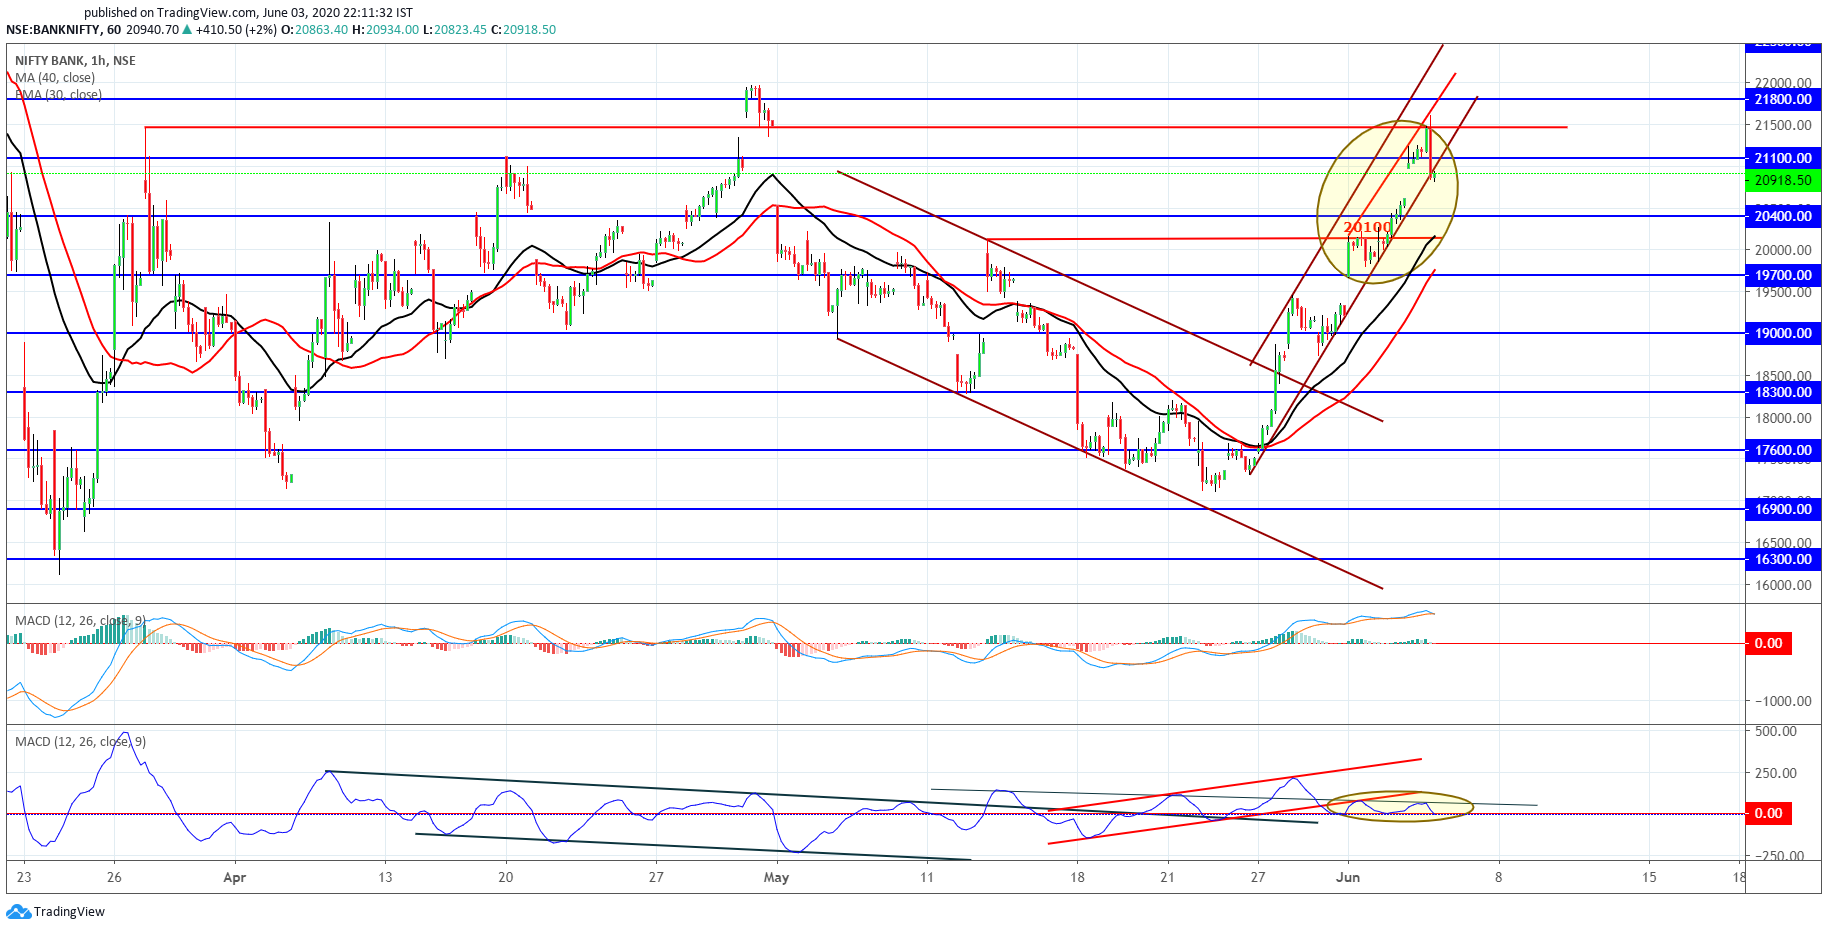
Observe the BIG Divergence in the MACD-Histogram line indicator on the hourly chart. It has more importance as Banknifty reversed from the resistance zone.
 
 
Gann Box Daily chart showing reversal from resistance and bearish Doji candle
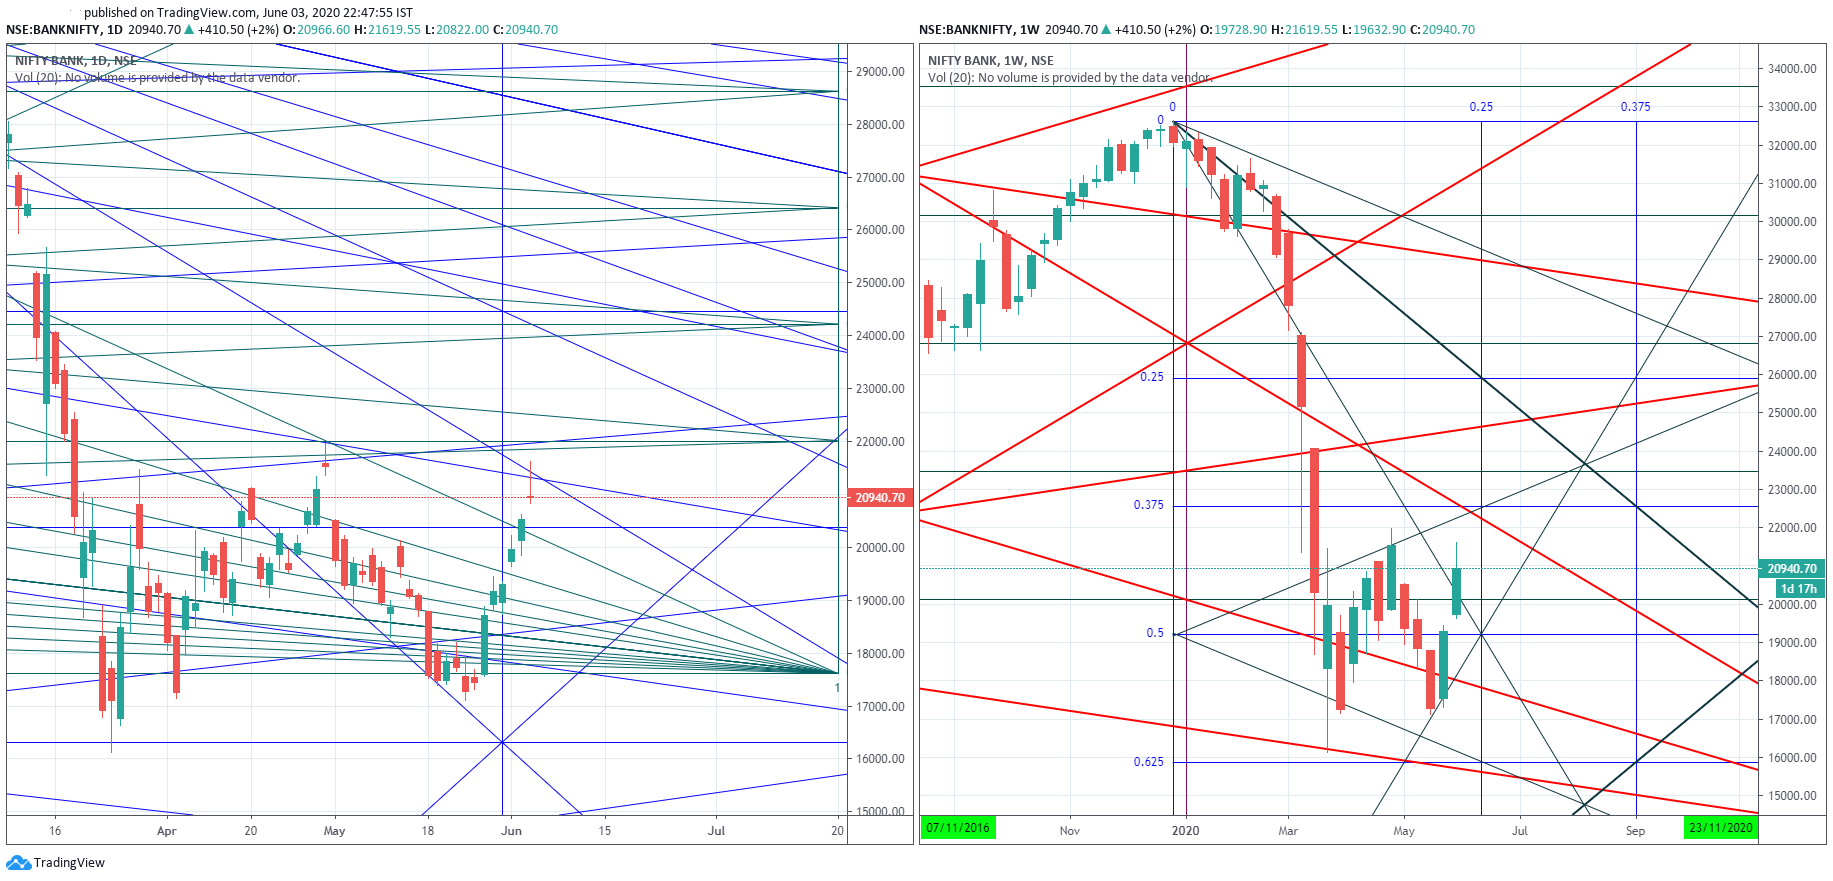
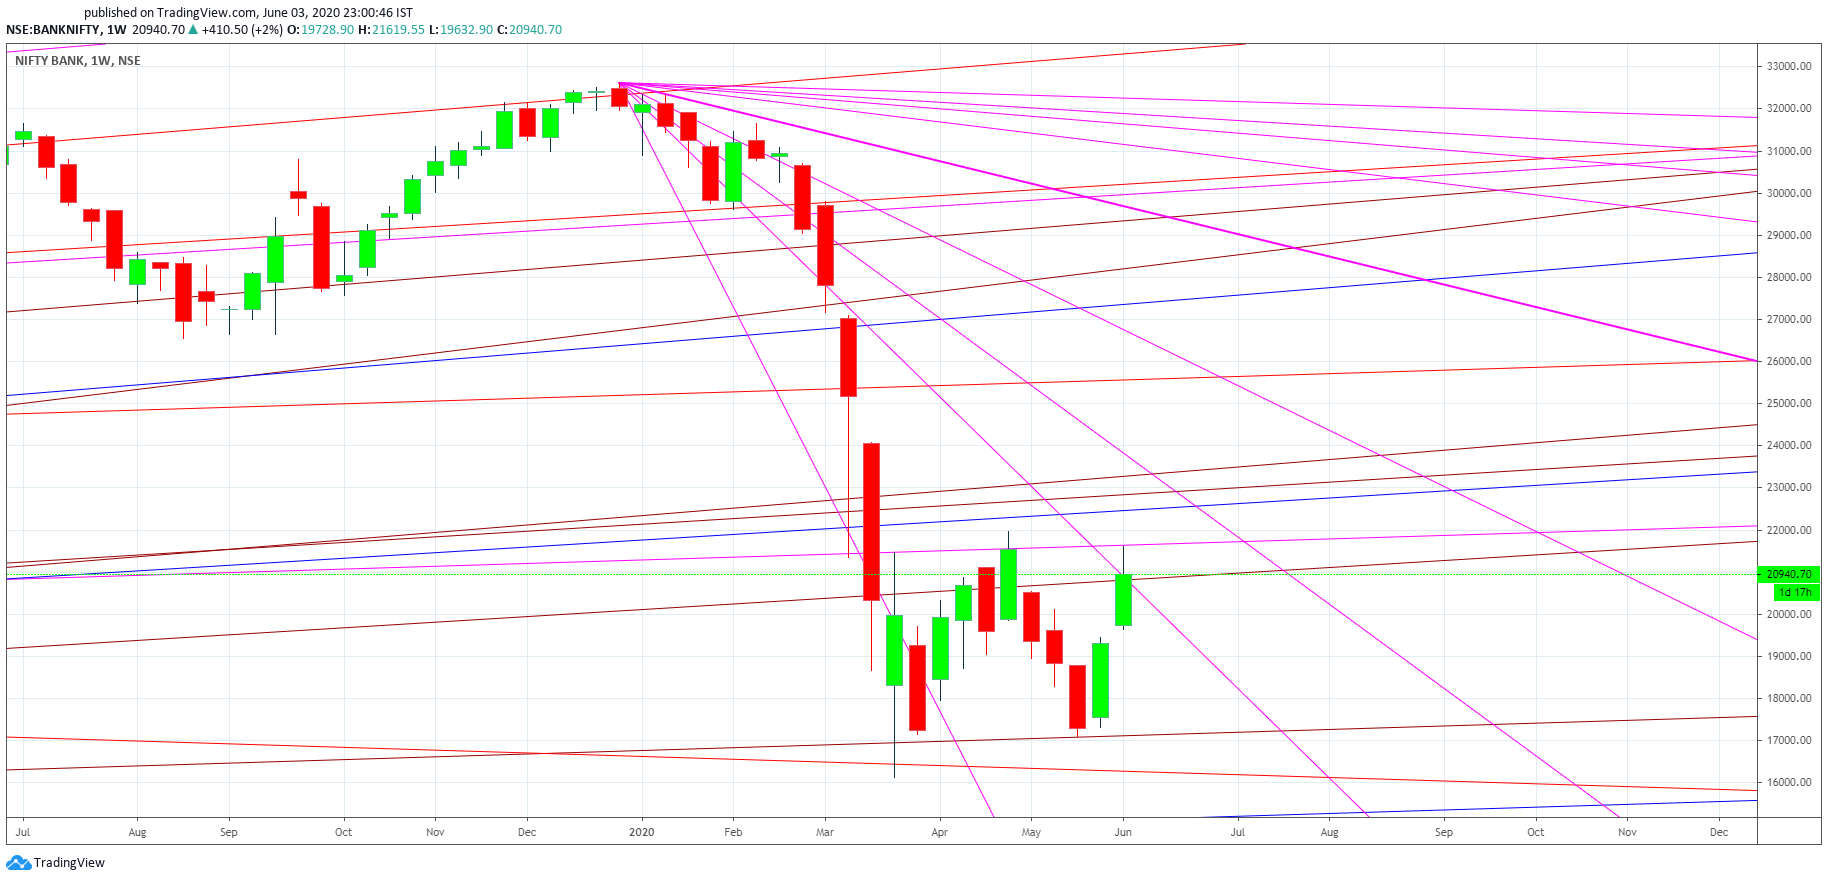
 
 
Weekly Gann Angles:
 
Resistance at Weekly angles and reversal.
 
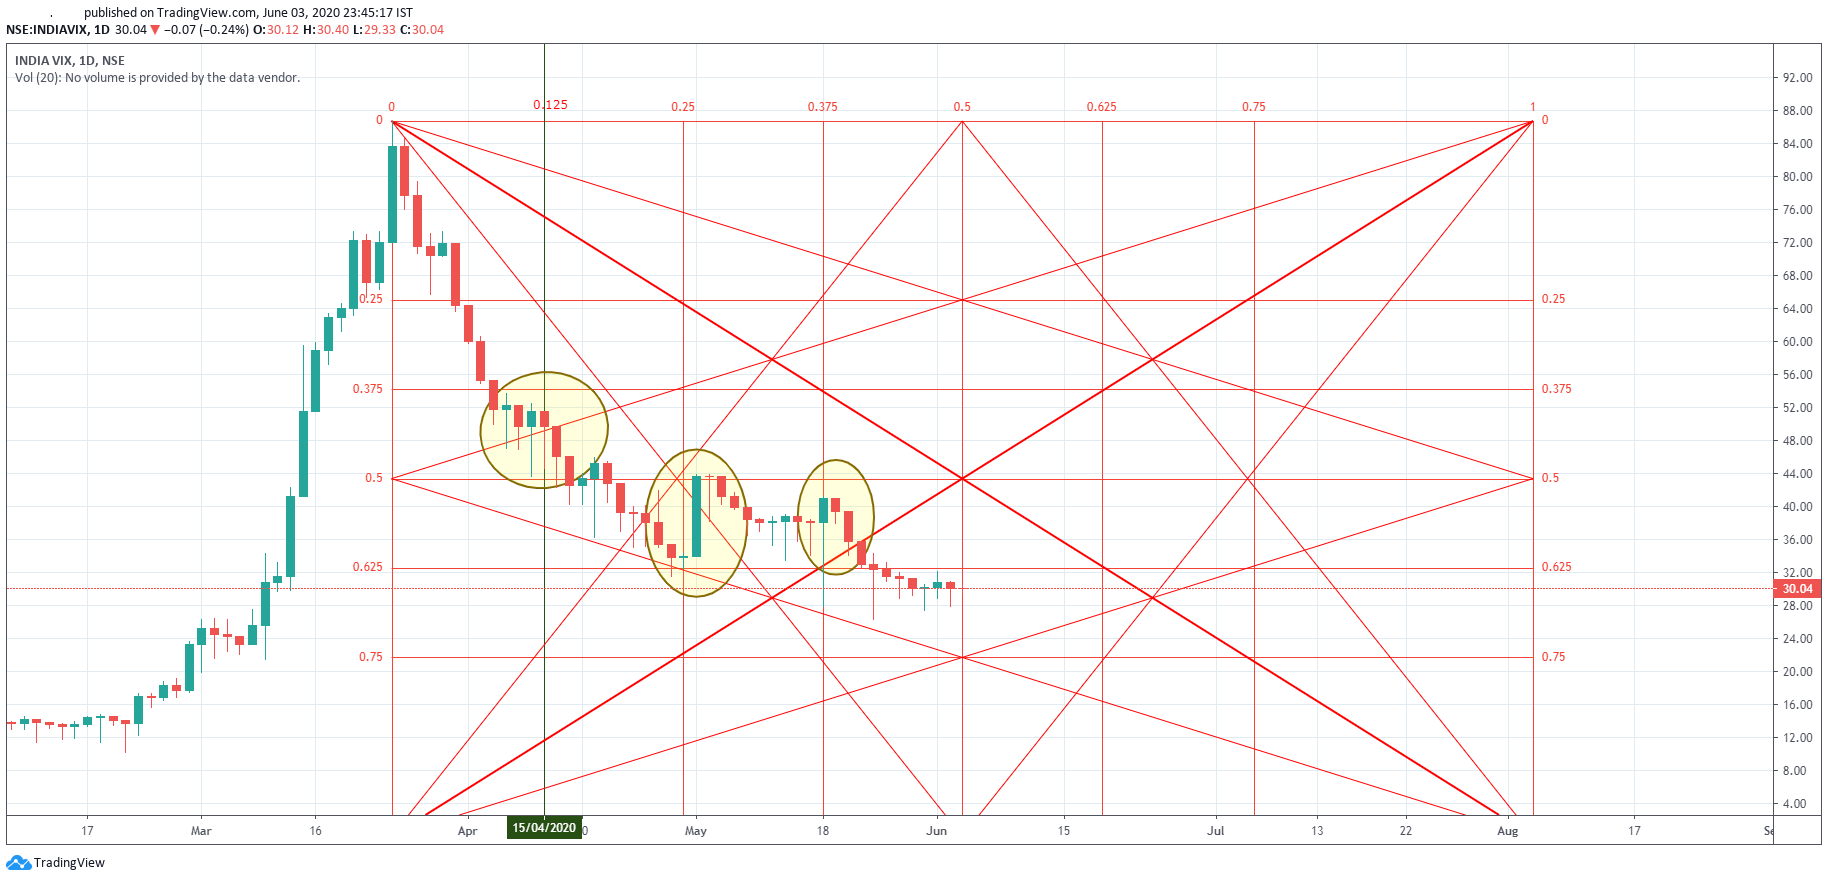
India VIX Daily Gann Box time cycle date is Jun-4.
 
So most of the setups are showing reversal from the resistance zone and hence the high probability of top is made today considering time cycles matching with the same.
0 Dislike
Follow 2

Please Enter a comment

Submit

Other Lessons for You

ANATOMY OF CANDLESTICKS
https://vz-3ad30922-ba4.b-cdn.net/e61db355-a307-4046-b148-1bb5d85b7c68/play_480p.mp4

Best Ways to Invest Money
Hi there, I will share my experience of investments, and that will relate and help you get some ideas and plans to invest your money wisely. To be frank and direct, I was having a dream of getting a...

Concept Of Angel Investing
The 21st century is known as the entrepreneur age where numbers of young & enthusiastic individuals are starting up their own ventures individually or collectively. Today most of these companies are...

Bollinger Bands
Bollinger Bands: A band plotted two standard deviations away from a 21 Day moving average. The Band widens during volatile markets and contract during consolidation Phase. The nearer the prices travel...

What are some of the important technical charts and indicators for intra-day trading?
For Indian market I use the following indicators and charting tools. You can experiment these: EMA (20,50). MACD. RSI. FSTO. Candlesticks patterns. Support and resistance patterns. Double top and...
X

Looking for Stock Market Trading Classes?

The best tutors for Stock Market Trading Classes are on UrbanPro

  • Select the best Tutor
  • Book & Attend a Free Demo
  • Pay and start Learning

Learn Stock Market Trading with the Best Tutors

The best Tutors for Stock Market Trading Classes are on UrbanPro

This website uses cookies

We use cookies to improve user experience. Choose what cookies you allow us to use. You can read more about our Cookie Policy in our Privacy Policy

Accept All
Decline All

UrbanPro.com is India's largest network of most trusted tutors and institutes. Over 55 lakh students rely on UrbanPro.com, to fulfill their learning requirements across 1,000+ categories. Using UrbanPro.com, parents, and students can compare multiple Tutors and Institutes and choose the one that best suits their requirements. More than 7.5 lakh verified Tutors and Institutes are helping millions of students every day and growing their tutoring business on UrbanPro.com. Whether you are looking for a tutor to learn mathematics, a German language trainer to brush up your German language skills or an institute to upgrade your IT skills, we have got the best selection of Tutors and Training Institutes for you. Read more