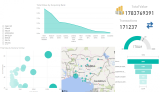
This Power BI report is designed to offer a time-based financial analysis that allows stakeholders to visualize how the company’s financial health is evolving.
By analyzing balance sheet components, cash flow activities, and company valuation metrics, the report provides actionable insights for decision-makers, investors, and analysts.
- Time-based trends: Users can compare the company's performance month-over-month across different metrics.
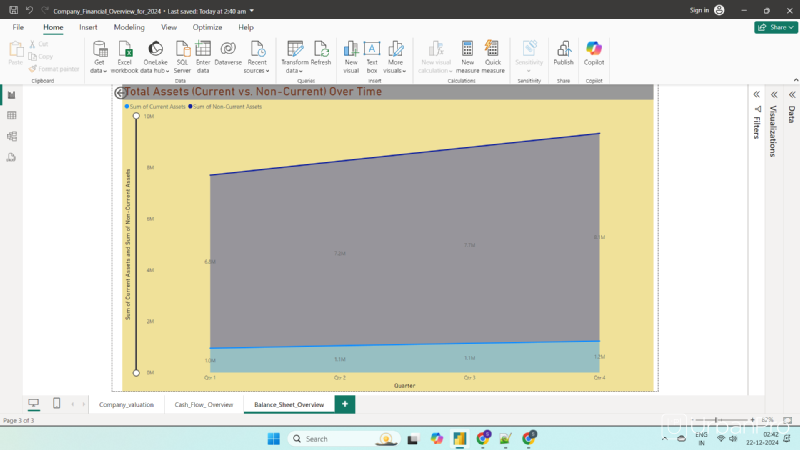
- Financial position: The balance sheet page helps understand the assets, liabilities, and equity changes.
- Liquidity and cash flow: The cash flow page provides visibility into the company's ability to generate cash and fund operations.
- Valuation and growth: The valuation page helps assess how the company is perceived in the market based on its performance.
This report will provide a clear overview of the company’s financial stability, performance, and market outlook over 2024.
In detail Report Insights:
- Balance Sheet Page: This will provide a snapshot of the company’s financial position, showing whether the company is growing its asset base or becoming more leveraged by increasing liabilities.
- Cash Flow Page: It will help track how well the company is managing its cash flow and liquidity, focusing on cash from operations, investing, and financing.
- Company Valuation Page: By tracking revenue, operating income, EBITDA, and market value, this page will give a clear picture of the company’s growth, profitability, and market perceptions over time.