


 You have successfully registered
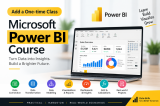

This comprehensive Power BI course is designed for beginners, students, working professionals, business analysts, aspiring data analysts and anyone who wants to learn Business Intelligence and data visualization using Microsoft Power BI.
The course follows a practical, step-by-step approach, starting with the fundamentals of Business Intelligence, Data Warehousing and Power BI architecture. Students will learn how to connect Power BI with different data sources such as Excel, CSV and other sources, import data and create interactive reports.
A major part of the course focuses on Power Query and data preparation. Students will learn data transformation techniques including M Query, pivoting, merging data, parameters, data type management, calculated columns and error handling.
Students will also learn data modeling, relationships, cardinality and filter directions, followed by practical visualization techniques. The visualization module covers charts, maps, gauges, slicers, filters, formatting, custom visuals and report design.
The course also introduces Power BI dashboards, tiles, Quick Insights and Q&A. A dedicated DAX module covers date and time, time intelligence, filter, logical, mathematical, text and other important DAX functions.
The final part of the course focuses on hands-on tasks and real-world business scenarios so that students can apply everything they learn to practical reporting and analytics problems.
Prerequisites: No prior Power BI experience is required. Basic knowledge of Excel and familiarity with data tables is helpful but not mandatory.
What to bring: A laptop/desktop with Power BI Desktop installed.


 View this Course



 Top Tutor



 Certified