
Course Description:
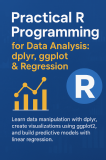
This course is designed for anyone looking to master R programming for data analytics in a practical, hands-on way. You will learn data manipulation using dplyr, including filtering, summarizing, grouping, and joining datasets efficiently. We focus on visualization with ggplot2, teaching you how to create insightful and professional charts while understanding the syntax and meaning behind every code line.
The course also covers linear regression, enabling you to build predictive models and interpret results confidently. Real-world examples and exercises help you apply your skills to business data, sales analytics, or research datasets. By the end, you’ll be able to write clean, reproducible R code, analyze datasets effectively, and present actionable insights. Whether you are a beginner or looking to enhance your data analysis skills, this course equips you with the knowledge to excel in data-driven roles.Beat Power BI /power query editor when you use R Deplyr for data manipulation