



 You have successfully registered


2-Week Crash Course on Stock Market Analysis Using Fundamental Analysis and Technical Analysis using Candlestick Charts
Duration: 10 Days
Target Audience
Beginners, traders, investors, finance students, treasury professionals, and market participants who want to understand price action and improve trading decisions using candlestick analysis.
Course Objective
By the end of this course, participants will be able to:
- Read and interpret candlestick charts confidently
- Identify trend direction and market sentiment
- Understand important candlestick patterns
- Use support, resistance, and volume effectively
- Build basic trading strategiesu using technical analysis
- Manage risk and avoid emotional trading mistakes
The course will be conducted on live charts and will have 40% theory and 60% practical teaching
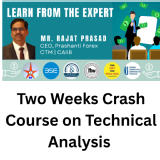
The Course is conducted by Prof Rajat Prasad who is a certified treasury professional having 25 plus years of Experience in Market
He is on panel on BSE , DNB and ITM college as a visiting faculty.
he regularly teaches MBA students. He has also taken sessions with HDFC Bank and Axis Bank officers


 View this Course
 Top Tutor




 Certified



