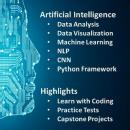
The Data Analysis and Visualization with Python course covers essential skills for extracting insights from data. It begins with an introduction to Python and its data analysis libraries such as Pandas and NumPy, focusing on data manipulation, cleaning, and transformation. Students learn to handle various data types and perform exploratory data analysis (EDA).
Key topics include:
- Python Basics: Syntax, variables, data types, control structures.
- Pandas: DataFrames, Series, data wrangling, aggregation, merging.
- NumPy: Arrays, mathematical operations, statistical functions.
- Data Visualization: Matplotlib and Seaborn for plotting, customizing plots, creating complex visualizations.
- EDA: Identifying patterns, outliers, and data distributions.
- Case Studies: Real-world datasets, project-based learning
- Final Project: Comprehensive analysis and visualization project.
The course emphasizes hands-on practice with real datasets, fostering skills to transform data into actionable insights.
Target Audience: Tcourse is designed for individuals seeking to enhance their data analysis skills using Python, one of the most popular programming languages in the field.