Find the best tutors and institutes for Class 10 Tuition
Search in
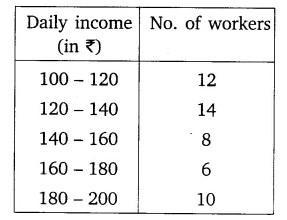
The following distribution gives the daily income of 50 workers of a factory.
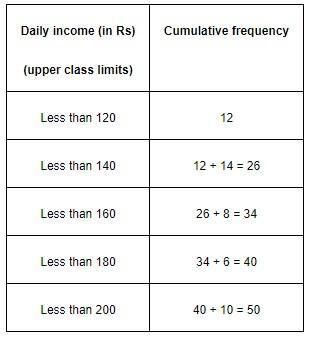
The frequency distribution table of less than type is as follows.
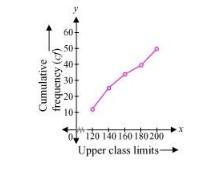
Taking upper class limits of class intervals on x-axis and their respective frequencies on y-axis, its ogive can be drawn as follows.
How helpful was it?
How can we Improve it?
Please tell us how it changed your life *
Please enter your feedback
UrbanPro.com helps you to connect with the best Class 10 Tuition in India. Post Your Requirement today and get connected.
Find best tutors for Class 10 Tuition Classes by posting a requirement.

Get started now, by booking a Free Demo Class