



Find the best tutors and institutes for Class 9 Tuition
Q2(ii):
The following data on the number of girls (to the nearest ten) per thousand boys in different sections of Indian society is given below.
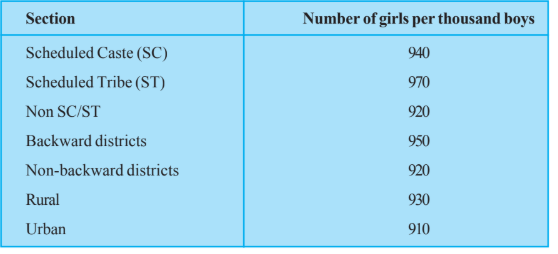
(ii) In the classroom discuss what conclusions can be arrived at from the graph.
The following data on the number of girls (to the nearest ten) per thousand boys in different sections of Indian society is given below.
(ii) In the classroom discuss what conclusions can be arrived at from the graph.
Solution :
Analytical Framework: Data Interpretation
To derive meaningful conclusions from the provided dataset representing the number of girls per thousand boys across six societal sections, we must first structure the data into a tabular format for comparative analysis.
| Section | Girls per 1000 Boys |
|---|---|
| Scheduled Caste (SC) | 940 |
| Scheduled Tribe (ST) | 970 |
| Non SC/ST | 920 |
| Backward Districts | 950 |
| Non-Backward Districts | 920 |
| Rural | 930 |
| Urban | 910 |
Step 1: Comparative Statistical Analysis
We analyze the variance between the maximum and minimum values to understand the skewness in sex ratio distribution.
- Maximum Value ($V_{max}$): $970$ (Scheduled Tribes)
- Minimum Value ($V_{min}$): $910$ (Urban areas)
- Range ($R$): $V_{max} - V_{min} = 970 - 910 = 60$
[Per the definition of Range in statistics, this indicates a moderate degree of disparity across the segments.]
Step 2: Deriving Sociological Conclusions
Based on the quantitative data provided, the following academic conclusions are established:
- The Highest Favorable Ratio: The Scheduled Tribe (ST) category exhibits the highest ratio of girls per thousand boys ($970$). This suggests a socio-cultural environment where, statistically, the parity between genders is more pronounced compared to other sections.
- Urban Disparity: The Urban sector records the lowest ratio ($910$). This counters the common assumption that higher economic development in urban centers automatically correlates with better gender ratios. This suggests potential social or economic factors—such as access to selective technologies or migration patterns—that may negatively influence the female-to-male ratio in cities.
- Regional Disparity (Backward vs. Non-Backward): Backward districts show a higher ratio ($950$) compared to Non-Backward districts ($920$). [By Comparative Data Analysis, this indicates that the index of economic advancement (Non-Backward) is not positively correlated with the sex ratio in this context.]
- Overall Trend: Across all categories, the number of girls per thousand boys is consistently below $1000$. This confirms a nationwide deficit in the female-to-male ratio across all analyzed sections of Indian society.
Visual Representation of Trend
Final Solution: The data reveals a systemic shortfall of girls relative to boys across all societal sections, with a maximum ratio of $970$ in Scheduled Tribes and a minimum ratio of $910$ in Urban areas, indicating that economic categorization does not guarantee a balanced sex ratio.
More Questions from Class 9 Mathematics Statistics EXERCISE 12.1
- Q1(i): A survey conducted by an organisation for the cause of illness and death among the women between the ages $15 - 44$ (in years) worldwide, found the following figures (in %) (i) Represent the information given above graphically.
- Q1(ii): A survey conducted by an organisation for the cause of illness and death among the women between the ages $15 - 44$ (in years) worldwide, found the following figures (in %): (ii) Which condition is the major cause of women’s ill health and death worldwide?
- Q1(iii): A survey conducted by an organisation for the cause of illness and death among the women between the ages $15 - 44$ (in years) worldwide, found the following figures (in %): (iii) Try to find out, with the help of your teacher, any two factors which play a major role in the cause in (ii) above being the major cause.
- Q2(i): The following data on the number of girls (to the nearest ten) per thousand boys in different sections of Indian society is given below. (i) Represent the information above by a bar graph.
- Q3(i): Given below are the seats won by different political parties in the polling outcome of a state assembly elections: (i) Draw a bar graph to represent the polling results.
- Q3(ii): Given below are the seats won by different political parties in the polling outcome of a state assembly elections: (ii) Which political party won the maximum number of seats?
- Q4(i): The length of 40 leaves of a plant are measured correct to one millimetre, and the obtained data is represented in the following table: (i) Draw a histogram to represent the given data. [Hint: First make the class intervals continuous]
- Q4(ii): The length of 40 leaves of a plant are measured correct to one millimetre, and the obtained data is represented in the following table: (ii) Is there any other suitable graphical representation for the same data?
- Q4(iii): The length of 40 leaves of a plant are measured correct to one millimetre, and the obtained data is represented in the following table: (iii) Is it correct to conclude that the maximum number of leaves are 153 mm long? Why?
- Q5(i): The following table gives the life times of 400 neon lamps: (i) Represent the given information with the help of a histogram.
- Q5(ii): The following table gives the life times of 400 neon lamps: (ii) How many lamps have a life time of more than 700 hours?
- Q6: The following table gives the distribution of students of two sections according to the marks obtained by them: Represent the marks of the students of both the sections on the same graph by two frequency polygons. From the two polygons compare the performance of the two sections.
- Q7: The runs scored by two teams A and B on the first 60 balls in a cricket match are given below: Represent the data of both the teams on the same graph by frequency polygons. [Hint : First make the class intervals continuous.]
- Q8: A random survey of the number of children of various age groups playing in a park was found as follows: Draw a histogram to represent the data above.
- Q9(i): 100 surnames were randomly picked up from a local telephone directory and a frequency distribution of the number of letters in the English alphabet in the surnames was found as follows: (i) Draw a histogram to depict the given information.
- Q9(ii): 100 surnames were randomly picked up from a local telephone directory and a frequency distribution of the number of letters in the English alphabet in the surnames was found as follows: (ii) Write the class interval in which the maximum number of surnames lie.
CBSE Solutions for Class 9 Mathematics Statistics
Chapters in CBSE - Class 9 Mathematics
Top Tutors who teach Statistics


 Top Tutor
 Bhamian Khurd, Ludhiana
 20 yrs of
Exp
 2 students
 12083 hrs of classes completed
 300
per hour
 Online Classes
Author of seven books, winner of the Best Teacher Award in a reputed CBSE school, winner of UrbanPro Excellence Award 2021 and more than 18 years of extensive teaching experience in school and college. I take group classes. I have been working as an ‘Associate Professor’ at a university since 2008. It gives me immense pleasure to hone spoken English and the soft skills of my students. I have experience in voice and accent training which is advantageous for refining your pronunciation. I can speak ENGLISH, HINDI and PUNJABI. Kindly SPECIFY YOUR QUERY CLEARLY WHILE SENDING ME a MESSAGE and avoid just sending Hi so I can help and guide you appropriately.



 Super Tutor
Malviya Nagar, Delhi
20 yrs of
Exp
35 students
4762 hrs of classes completed
450
per hour
Online Classes
I have the experience of teaching the above subjects for the last 20 years. I have also received a letter of commendation for valuable contribution to teaching in C B S E School by H R D Ministry signed by Honorable Minister Smriti Irani in the year 2015. I have taught in different schools i.e. DPS Bokaro, D P S Bhagalpur as guest teacher of Social Science for Pre foundation course preparing the students for N T S E and other competitive examinations under the Kota based Institute RAO IIT ACADEMY under RAO EDUSOLUTIONS PVT. LTD., Head Office at Mumbai . With regards to my teaching methodology I have always tried to make my subject and its contents easier to be delivered amongst my students so that they consider it an interesting subject and they could make it useful in their day to day life as the aim of education is to make a good human being and a responsible global citizen. I have qualified C T E T conducted by C B S E and participated in different workshops conducted by schools under C B S E and my school too
Best teacher for social studies. He has very good teaching experience. The way of his teaching is very good.


 Top Tutor
Pathardi Phata Dnyaneshwar Nagar, Nashik
7 yrs of
Exp
1 student
159 hrs of classes completed
400
per hour
 Student's Home
 Tutor's home
 Top Tutor
Vasant Kunj, Delhi
5 yrs of
Exp
6 students
205 hrs of classes completed
1000
per hour
Online Classes
Student's Home
Tutor's home
I am a Mathematics teacher providing online classes since January 2021. My strength in the subject is derived from my Engineering background which was further honed through statistical subjects while doing my MBA from the Indian School of Business in Hyderabad. My accomplishments in mathematics include 97% in CBSE Mathematics board exams and a full score of 51 in the quant section of the GMAT exam.
 Top Tutor
Mathura Road, Delhi
20 yrs of
Exp
3 students
1740 hrs of classes completed
1000
per hour
Online Classes
Tutor's home
I have been teaching Class 9 tuition for the past 20 years. I have a deep understanding of the syllabus and the curriculum, and I can explain concepts clearly and concisely. I am also patient and supportive, and I am always willing to go the extra mile to help my students succeed. In my classes, I use a variety of teaching methods to keep my students engaged and motivated. I use a combination of lectures, discussions, and hands-on activities to help my students learn. I also provide regular feedback to my students so that they can track their progress and identify areas where they need to improve. I am confident that I can help your child succeed in Class 9. I am a dedicated and experienced teacher, and I am passionate about helping my students learn. I am also committed to providing a positive and supportive learning environment for all of my students. Here are some specific examples of my teaching experience in Class 9 Tuition: I helped a student who was struggling with mathematics to improve their grade from a C to a B. I helped a student who was struggling with science to improve their grade from a D to a C+. I helped a student who was struggling with English to improve their grade from a B- to a B. I helped a student who was struggling with social studies to improve their grade from a C to a B+. I am confident that I can
My son is learning well with Amit sir. After the class sir always provide him practice homework questions. Looking forward for more learning experiences in future.