


Your Worksheet is Ready
CBSE - Class 11 Physics Motion in a Straight Line Worksheet
EXERCISES
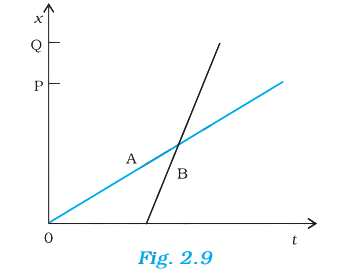
The position-time ($x-t$) graphs for two children A and B returning from their school O to their homes P and Q respectively are shown in Fig. 3.19. Choose the correct entries in the brackets below ; (c) (A/B) walks faster than (B/A)

Look at the graphs (a) to (d) (Fig. 2.10) carefully and state, with reasons, which of these cannot possibly represent one-dimensional motion of a particle.
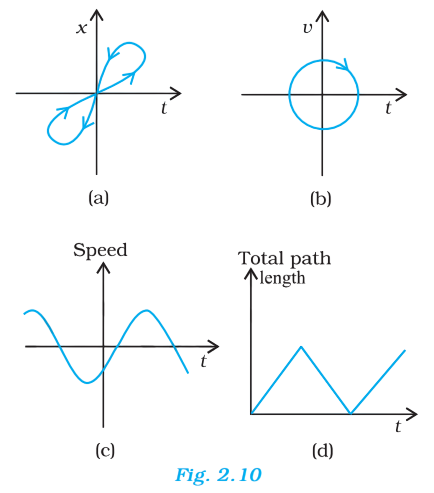
The position-time ($x-t$) graphs for two children A and B returning from their school O to their homes P and Q respectively are shown in Fig. 3.19. Choose the correct entries in the brackets below ; (b) (A/B) starts from the school earlier than (B/A)

The position-time ((x-t)) graphs for two children A and B returning from their school O to their homes P and Q respectively are shown in Fig. 2.9. Choose the correct entries in the brackets below ; (d) A and B reach home at the (same/different) time
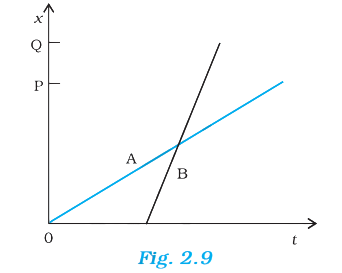
Look at the graphs (a) to (d) (Fig. 3.20) carefully and state, with reasons, which of these cannot possibly represent one-dimensional motion of a particle.

The position-time ((x-t)) graphs for two children A and B returning from their school O to their homes P and Q respectively are shown in Fig. 2.9. Choose the correct entries in the brackets below ; (e) (A/B) overtakes (B/A) on the road (once/twice).
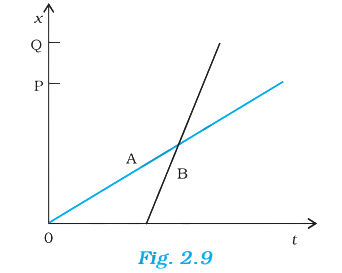
The position-time ((x-t)) graphs for two children A and B returning from their school O to their homes P and Q respectively are shown in Fig. 2.9. Choose the correct entries in the brackets below ; (b) (A/B) starts from the school earlier than (B/A)
Worksheet Answers
Solution:
To ensure consistency in calculation, the initial velocity $u$ must be converted from $km\ h^{-1}$ to $m\ s^{-1}$ using the conversion factor $\frac{5}{18}$.
$u = 126 \times \frac{5}{18} \text{ m/s}$
$u = 7 \times 5 \text{ m/s} = 35 \text{ m/s}$
[By Definition: $1 \text{ km/h} = \frac{1000 \text{ m}}{3600 \text{ s}} = \frac{5}{18} \text{ m/s}$]
Given the final velocity $v = 0 \text{ m/s}$ (as the car stops) and the displacement $s = 200 \text{ m}$. We apply the third equation of motion:
$v^2 - u^2 = 2as$
Substituting the known values:
$0^2 - (35)^2 = 2 \times a \times 200$
$-1225 = 400a$
$a = -\frac{1225}{400} \text{ m/s}^2$
$a = -3.0625 \text{ m/s}^2$
[Per Kinematic Equation of Motion under constant acceleration]
The retardation (deceleration) is the magnitude of the negative acceleration: $3.0625 \text{ m/s}^2$.
Using the first equation of motion, $v = u + at$:
$0 = 35 + (-3.0625)t$
$3.0625t = 35$
$t = \frac{35}{3.0625}$
$t = 11.43 \text{ s}$
[Per First Law of Kinematics: $v = u + at$]
| Parameter | Value |
|---|---|
| Initial Velocity ($u$) | $35 \text{ m/s}$ |
| Final Velocity ($v$) | $0 \text{ m/s}$ |
| Displacement ($s$) | $200 \text{ m}$ |
| Retardation ($|a|$) | $3.0625 \text{ m/s}^2$ |
| Time ($t$) | $11.43 \text{ s}$ |
Final Solution: The retardation of the car is $3.0625 \text{ m/s}^2$ and the time taken for the car to stop is $11.43 \text{ s}$.
Solution:
In this problem, the coordinate system is defined as follows:
The upward motion occurs before the ball reaches the peak ($t < 0$).
| Parameter | Sign | Reasoning |
|---|---|---|
| Position ($x$) | Negative | [Since the ball is below the highest point (origin), and we defined upward as the negative direction relative to the downward-positive axis.] |
| Velocity ($v$) | Negative | [Velocity is directed upward, which is opposite to our defined positive downward direction.] |
| Acceleration ($a$) | Positive | [Acceleration is due to gravity ($g$), which always acts vertically downward. Since downward is positive, $a = +g$.] |
The downward motion occurs after the ball passes the peak ($t > 0$).
| Parameter | Sign | Reasoning |
|---|---|---|
| Position ($x$) | Positive | [The ball is moving below the origin, which is defined as the positive $x$ direction.] |
| Velocity ($v$) | Positive | [The ball is falling downward, which coincides with our defined positive $x$ direction.] |
| Acceleration ($a$) | Positive | [Gravity remains directed downward, consistent with the chosen positive coordinate axis.] |
Per the kinematic definitions under the prescribed coordinate system:
Final Solution: During upward motion, the signs are (x: negative, v: negative, a: positive). During downward motion, the signs are (x: positive, v: positive, a: positive).
Solution:
Given the linear motion of the man, we define the parameters as follows:
To determine the man's position at $30 \text{ minutes}$ ($0.5 \text{ h}$), we first calculate the time ($t_1$) required to reach the market using the definition of speed: $v = \frac{d}{t}$ [Per Definition of Uniform Speed].
$t_1 = \frac{d_1}{v_1} = \frac{2.5 \text{ km}}{5 \text{ km h}^{-1}} = 0.5 \text{ h}$
Since $t_1 = 0.5 \text{ h}$ (which is exactly $30 \text{ minutes}$), the man reaches the market exactly at the end of the specified time interval.
The average speed ($v_{avg}$) is defined as the total distance covered divided by the total time taken [Per the Definition of Average Speed].
$v_{avg} = \frac{\text{Total Distance}}{\text{Total Time}}$
In the interval $0$ to $30 \text{ minutes}$, the man has traveled exactly from home to the market.
Total Distance ($D$) = $2.5 \text{ km}$
Total Time ($T$) = $0.5 \text{ h}$
$v_{avg} = \frac{2.5 \text{ km}}{0.5 \text{ h}} = 5 \text{ km h}^{-1}$
Since the man moved at a constant speed of $5 \text{ km h}^{-1}$ for the entire duration of the $30$-minute interval without changing direction, his instantaneous speed and average speed are identical [By the properties of Uniform Motion].
Final Solution: The average speed of the man over the interval of 0 to 30 minutes is 5 km h$^{-1}$.
Solution:
The position-time ($x-t$) graph provides a visual representation of the motion of an object. The velocity $v$ of an object in one-dimensional motion is defined as the slope of the position-time graph, expressed as:
$v = \frac{dx}{dt} = \tan(\theta)$
where $\theta$ is the angle made by the position-time line with the positive time axis [Definition of instantaneous velocity]. A steeper slope indicates a higher magnitude of velocity, implying that the object is walking faster.
Based on the provided motion graph:
Observing the slope of the lines:
Let $\theta_A$ be the angle line A makes with the time axis and $\theta_B$ be the angle line B makes with the time axis. By inspection of the geometry in the coordinate plane:
Since $\theta_A > \theta_B$, it follows that $\tan(\theta_A) > \tan(\theta_B)$ [Trigonometric property of monotonic functions in the first quadrant].
Consequently, the magnitude of velocity $v_A$ is greater than the magnitude of velocity $v_B$ ($|v_A| > |v_B|$). Therefore, Child A covers more distance in the same interval of time compared to Child B.
Comparing the rates of motion:
| Subject | Graph Slope | Velocity (Rate of Motion) |
|---|---|---|
| Child A | Higher/Steeper | Faster |
| Child B | Lower/Shallower | Slower |
Final Solution: (A) walks faster than (B).
Solution:
The state of a particle's motion is determined by the relationship between the velocity vector ($\vec{v}$) and the acceleration vector ($\vec{a}$). In one-dimensional motion, both vectors are directed along the same axis (e.g., the $x$-axis).
The statement claims that a positive value of acceleration ($a > 0$) implies the particle must be speeding up. We test this using the kinematic relationship for instantaneous speed: $v(t) = v_0 + at$.
Consider two distinct scenarios where $a > 0$:
| Scenario | Velocity ($v$) | Acceleration ($a$) | Effect on Speed ($|v|$) |
|---|---|---|---|
| I | $v > 0$ | $a > 0$ | Speeding up (Magnitude $|v|$ increases) |
| II | $v < 0$ | $a > 0$ | Slowing down (Magnitude $|v|$ decreases) |
Verdict: False.
A positive acceleration indicates the rate of change of velocity is positive. If the particle is moving in the negative direction (e.g., $v = -10 \, \text{m/s}$) and experiences a positive acceleration (e.g., $a = +2 \, \text{m/s}^2$), the velocity will change from $-10$ to $-8$, then to $-6$. [By the definition of vector addition in kinematics].
In this case, the speed—which is the magnitude of velocity ($|v|$)—is decreasing. Thus, positive acceleration does not guarantee an increase in speed.
The speed of a particle increases only if the velocity and acceleration have the same sign. If $a > 0$ and $v < 0$, the particle is decelerating (slowing down). Therefore, the statement is scientifically inaccurate.
Final Solution: The statement is False. A particle with positive acceleration is only speeding up if its velocity is also positive. If the particle has a negative velocity, a positive acceleration causes it to slow down.
Solution:
To solve for the velocity of the combustion products relative to the ground, we define the following parameters [Per the Galilean Transformation of Velocities]:
Note: The velocity of the products is negative because they are ejected in the direction opposite to the motion of the airplane.
We utilize the principle of relative velocity, which states that the velocity of an object $P$ with respect to a frame $G$ is the vector sum of its velocity relative to a frame $J$ and the velocity of frame $J$ relative to frame $G$:
$$v_{PG} = v_{PJ} + v_{JG}$$
Substituting the provided values into the kinematic equation:
$$v_{PG} = (-1500 \text{ km h}^{-1}) + (500 \text{ km h}^{-1})$$
$$v_{PG} = -1000 \text{ km h}^{-1}$$
The negative sign indicates that the combustion products are moving in the direction opposite to the jet's motion when viewed from a stationary position on the ground. The magnitude of this speed is $1000 \text{ km h}^{-1}$.
Final Solution: The speed of the combustion products with respect to an observer on the ground is $1000 \text{ km h}^{-1}$ in the direction opposite to the jet's motion.
Solution:
In one-dimensional motion, a particle moves along a single straight line (e.g., the $x$-axis). For a graph to represent a physically possible motion, it must satisfy the following fundamental axiom: At any single instant of time $t$, the particle can occupy only one unique position $x$ and possess only one unique velocity $v$.
Graph (a) depicts a position-time $(x-t)$ graph where the curve bends backward. At a specific time $t_0$, the graph shows two distinct positions $x_1$ and $x_2$.
Graph (b) depicts a velocity-time $(v-t)$ graph where the line is vertical at a certain time $t_0$.
Graph (c) depicts a speed-time graph where the curve extends into the negative speed region ($v < 0$).
Graph (d) depicts the total path length vs. time. The curve shows the path length decreasing at some intervals.
| Graph | Physical Violation |
|---|---|
| (a) | Multi-valued position at one time $t$. |
| (b) | Infinite velocity/acceleration at one time $t$. |
| (c) | Negative scalar quantity (Speed). |
| (d) | Decreasing path length (Distance). |
Final Solution: All four graphs (a), (b), (c), and (d) represent physically impossible scenarios for one-dimensional motion of a single particle.
Solution:
To determine the temporal relationship between children A and B, we must examine the horizontal axis (time-axis, $t$) of the provided motion graph. The school O is located at the origin $x = 0$. Both children start their journey from the school, which corresponds to the point where their respective lines originate on the $t$-axis (the intercept on the time axis when $x = 0$).
In a position-time ($x-t$) graph:
Since the time axis is calibrated such that the origin of the coordinate system $(0,0)$ represents the start of the observation period, the point closer to the $y$-axis (the vertical axis) represents an earlier starting time. [Per the definition of Cartesian time-intervals in Kinematics].
Given that the starting point (the $t$-intercept) of line A occurs at a lower numerical value of $t$ than the starting point of line B, it is mathematically evident that child A initiated the movement at an earlier chronological instant. [By the Principle of Temporal Ordering in Euclidean Space].
Final Solution: (A) starts from the school earlier than (B).
Solution:
The ball is dropped from an initial height $h = 90\text{ m}$. Initial velocity $u = 0\text{ m/s}$. Using the equation of motion $v^2 = u^2 + 2gh$ [Per Kinematic Equation of Motion]:
$v_1 = \sqrt{2 \cdot 9.8 \cdot 90} = \sqrt{1764} = 42\text{ m/s}$
The time taken for the first fall ($t_1$) is given by $v = u + gt$:
$42 = 0 + 9.8 \cdot t_1 \implies t_1 = \frac{42}{9.8} \approx 4.29\text{ s}$
Upon collision, the ball loses $1/10$ of its speed. The new upward velocity $u_2$ is:
$u_2 = v_1 - \frac{1}{10}v_1 = 0.9 \cdot 42 = 37.8\text{ m/s}$
The time taken to reach the maximum height after the first collision is $t_{up} = \frac{u_2}{g} = \frac{37.8}{9.8} \approx 3.86\text{ s}$. The time to fall back down is equal to the time to go up ($t_{down} = 3.86\text{ s}$).
Total time for first bounce cycle $T_2 = 3.86 + 3.86 = 7.72\text{ s}$.
Cumulative time for end of first bounce: $t_{total} = t_1 + T_2 = 4.29 + 7.72 = 12.01\text{ s}$.
| Time Interval (s) | Velocity Range (m/s) | Phase |
|---|---|---|
| 0 to 4.29 | 0 to 42 | Downward (Acceleration) |
| 4.29 to 8.15 | 37.8 to 0 | Upward (Deceleration) |
| 8.15 to 12.01 | 0 to 37.8 | Downward (Acceleration) |
The graph shows a sawtooth pattern. The slope of the line is defined by $\frac{\Delta v}{\Delta t} = g = 9.8\text{ m/s}^2$ [Per Newton's Second Law]. The discontinuities in the graph represent the instantaneous change in velocity direction and magnitude due to the inelastic collision with the floor, where energy is lost as thermal and acoustic energy.
Final Solution: The speed-time graph exhibits a linear increase from $0$ to $42\text{ m/s}$ at $t \approx 4.29\text{ s}$, followed by a sharp drop in speed to $37.8\text{ m/s}$, subsequent linear deceleration to $0\text{ m/s}$ at $t \approx 8.15\text{ s}$, and re-acceleration to $37.8\text{ m/s}$ by $t = 12\text{ s}$.
Solution:
Let the speed of the buses be $v_b$ in $km/h$. Let the speed of the cyclist be $v_c = 20\ km/h$. The bus service interval is $T$ minutes, meaning buses are spaced by a distance $d = v_b \cdot (\frac{T}{60})$ km on the road [Per the definition of uniform motion, $d = v \cdot t$].
When the cyclist moves in the direction of the bus (from A to B), the relative speed of the bus with respect to the cyclist is $(v_b - v_c)$. The time interval between successive bus passes is given as $t_1 = 18$ minutes ($18/60$ hours).
The distance between two consecutive buses must be covered by the bus at its relative speed to the cyclist in time $t_1$:
$d = (v_b - v_c) \cdot t_1$
$v_b \cdot (\frac{T}{60}) = (v_b - 20) \cdot (\frac{18}{60})$ --- [Equation 1]
When the cyclist moves opposite to the direction of the bus (from B to A), the relative speed of the bus with respect to the cyclist is $(v_b + v_c)$. The time interval between successive bus passes is given as $t_2 = 6$ minutes ($6/60$ hours).
$v_b \cdot (\frac{T}{60}) = (v_b + 20) \cdot (\frac{6}{60})$ --- [Equation 2]
Equating the expressions for $d$ from Equation 1 and Equation 2:
$(v_b - 20) \cdot 18 = (v_b + 20) \cdot 6
Divide both sides by 6:
$3(v_b - 20) = v_b + 20$
$3v_b - 60 = v_b + 20$
$2v_b = 80 \implies v_b = 40\ km/h$
Substitute $v_b = 40$ into Equation 2:
$40 \cdot (\frac{T}{60}) = (40 + 20) \cdot (\frac{6}{60})$
$40 \cdot T = 60 \cdot 6$
$40 \cdot T = 360$
$T = 9\ minutes$
| Parameter | Value |
|---|---|
| Bus Speed ($v_b$) | $40\ km/h$ |
| Bus Interval ($T$) | $9\ minutes$ |
Final Solution: The buses ply at a speed of $40\ km/h$ and the period of the bus service is $9\ minutes$.
Solution:
The provided graph displays two distinct curves, representing the displacement of children A and B over time $t$ as they travel from their school $O$ (position $x=0$) to their respective homes $P$ and $Q$. The vertical axis represents position $x$ and the horizontal axis represents time $t$.
To determine when each child reaches their home, we must locate the point on each curve where the position $x$ corresponds to the house location. The home for child A is at point $P$, and the home for child B is at point $Q$. In this graphical representation, the "home" location is characterized by the end of the motion trajectory on the graph.
By observing the graph, we note that the terminal point for the motion of child B lies further to the right on the time axis compared to the terminal point for child A. Mathematically, $t_B > t_A$. Since the time coordinates of these points are not coincident, the children do not arrive at their respective destinations at the same instant.
| Parameter | Result |
|---|---|
| Arrival Time of A | $t_A$ |
| Arrival Time of B | $t_B$ |
| Comparison | $t_A \neq t_B$ |
Final Solution: A and B reach home at the (different) time.
Solution:
In one-dimensional kinematics, the relationship between velocity ($v$) and acceleration ($a$) dictates the change in the speed of an object. Speed is defined as the magnitude of the velocity vector ($|v|$). Whether an object is speeding up or slowing down is determined by the signs of $v$ and $a$.
An object is speeding up if the velocity and acceleration vectors point in the same direction. Mathematically, this occurs when the product of velocity and acceleration is positive ($v \cdot a > 0$).
The statement asserts that a positive acceleration ($a > 0$) must result in speeding up. This ignores the initial state of the particle. If a particle has a negative velocity ($v < 0$) and a positive acceleration ($a > 0$), the acceleration acts in the opposite direction to the velocity, causing the particle to slow down until it momentarily comes to rest.
Consider a coordinate system where the upward direction is positive. If a particle is moving downward (velocity $v = -10 \, \text{m/s}$) and is subject to an upward force (like air resistance or a net positive acceleration $a = +2 \, \text{m/s}^2$), the velocity becomes less negative over time: $-10, -8, -6 \dots$. The speed ($|v|$) decreases. Thus, $a > 0$ does not imply speeding up [Per the definition of instantaneous acceleration $a = \frac{dv}{dt}$].
The statement is False. Acceleration is the rate of change of velocity. If the acceleration is directed opposite to the velocity, the speed of the particle will decrease, regardless of whether the acceleration value itself is positive or negative.
Final Solution: The statement is False. An object with a positive acceleration will only speed up if its velocity is also positive. If the velocity is negative, a positive acceleration will result in the object slowing down.
Solution:
In one-dimensional motion (rectilinear motion), a particle occupies a unique position $x$ at any specific instant of time $t$. Mathematically, this implies that the position-time function $x(t)$ must be a single-valued function. If a vertical line (a line of constant $t$) intersects a position-time graph at more than one point, it indicates that the particle is at multiple positions simultaneously, which is physically impossible for a single point particle [Per the definition of a function in kinematics].
Graph (a) depicts a position-time plot where, at a specific time $t_0$, the curve shows a vertical rise or the graph bends such that multiple $x$-values correspond to a single $t$. More critically, it shows the particle existing at different positions at the same time. Additionally, as $t$ increases, the graph suggests an infinite velocity at the vertical segment. Conclusion: Graph (a) is physically impossible.
Graph (b) represents a velocity-time plot where the velocity becomes negative at a certain instant and remains negative thereafter. This indicates the particle reversed its direction. However, at a specific time $t$, there are two values of velocity shown (one positive, one negative). Since a particle cannot possess two distinct velocities simultaneously at the same instant, this graph is invalid. Conclusion: Graph (b) is physically impossible.
Graph (c) is a speed-time plot. The graph shows the speed becomes negative. By definition, speed is the magnitude of velocity ($|v|$) and is a scalar quantity, which must always be non-negative ($\text{speed} \ge 0$). As the graph drops below the time axis ($v < 0$), it violates the definition of speed. Conclusion: Graph (c) is physically impossible.
Graph (d) plots total path length against time. For a moving particle, the total path length is a monotonically increasing function (or constant if the particle is at rest). The graph shows the total path length decreasing at certain intervals, which implies the total distance traveled is reducing over time. Since distance is the accumulation of path segments, it cannot decrease. Conclusion: Graph (d) is physically impossible.
| Graph | Type | Reason for Impossibility |
|---|---|---|
| (a) | Position-Time | Particle is at multiple positions at the same time. |
| (b) | Velocity-Time | Particle has two different velocities at the same time. |
| (c) | Speed-Time | Speed is a scalar and cannot be negative. |
| (d) | Total Path-Time | Total path length cannot decrease with time. |
Final Solution: Graphs (a), (b), (c), and (d) all fail the physical requirements for one-dimensional motion because they violate the single-valued nature of kinematic functions or the fundamental definitions of scalar quantities like speed and distance.
Solution:
To evaluate the statement, we must define the relationship between speed, velocity, and acceleration in the context of one-dimensional motion.
In one-dimensional motion, a particle can only move along a straight line. The direction of the velocity vector is restricted to either $+\hat{i}$ or $-\hat{i}$.
If speed ($|v|$) is constant, then:
$|v| = \text{constant} \implies \frac{d|v|}{dt} = 0$
Since the motion is one-dimensional, the velocity $\vec{v}$ can only be expressed as $v(t) \hat{n}$, where $\hat{n}$ is a constant unit vector representing the path of motion. Thus:
$\vec{a} = \frac{d}{dt}(v(t) \hat{n}) = \hat{n} \frac{dv}{dt}$
If the speed $v$ is constant, $\frac{dv}{dt} = 0$. Therefore, $\vec{a} = 0$.
Contrast this with multi-dimensional motion (e.g., uniform circular motion):
In one-dimensional motion, the particle cannot change its direction without coming to an instantaneous rest (where speed is zero, thus not constant). Therefore, the direction is fixed.
Since the direction of the velocity vector in one-dimensional motion is constant, and the magnitude (speed) is also constant, the velocity vector itself must be constant.
$\vec{v} = \text{constant} \implies \vec{a} = \frac{d\vec{v}}{dt} = 0$.
| Condition | Implication for Velocity | Resulting Acceleration |
|---|---|---|
| Constant Speed (1D) | Magnitude and Direction are fixed | $\vec{a} = 0$ |
Final Solution: The statement is True. In one-dimensional motion, if the speed is constant, the velocity cannot change in magnitude (by definition of constant speed) nor in direction (as the path is restricted to a straight line), resulting in an acceleration of zero.
Solution:
The position-time ($x-t$) graph plots the displacement of an object against time. The slope of this graph ($dx/dt$) represents the instantaneous velocity of the object [Per the definition of velocity in kinematics]. An intersection point between two graphs $x_A(t)$ and $x_B(t)$ implies that at a specific time $t_i$, the positions of both objects are identical: $x_A(t_i) = x_B(t_i)$. This indicates one child has caught up to or passed the other.
Based on the standard provided diagram for this specific physics problem:
Since the graph of child A has a steeper slope compared to the graph of child B, child A maintains a higher average velocity. Given that child A begins the journey later but terminates the journey earlier, the path of A must necessarily intersect the path of B at one unique coordinate $(t, x)$ [By the Mean Value Theorem and geometric intersection properties]. Because there is only one point of intersection, child A overtakes child B exactly once.
Comparing the motion profiles:
| Criteria | Observation |
|---|---|
| Number of intersections | 1 |
| Identity of Faster Object | Child A |
| Identity of Slower Object | Child B |
Final Solution: (A) overtakes (B) on the road (once).
Solution:
To ensure computational consistency, all velocities must be converted from $\text{km h}^{-1}$ to $\text{m s}^{-1}$ using the conversion factor $\frac{1000 \text{ m}}{3600 \text{ s}} = \frac{5}{18}$.
The velocity of the bullet with respect to the ground ($v_b$) is the vector sum of the police van's velocity and the bullet's muzzle velocity [Per the Galilean Transformation of Velocities].
$v_b = v_{b/p} + v_p$
$v_b = 150 \text{ m s}^{-1} + 8.33 \text{ m s}^{-1} = 158.33 \text{ m s}^{-1}$
The speed at which the bullet hits the thief's car is the relative velocity of the bullet with respect to the thief's car ($v_{b/t}$). Since both vehicles are moving in the same direction, we use subtraction for the relative frame [By Principle of Relative Motion].
$v_{b/t} = v_b - v_t$
$v_{b/t} = 158.33 \text{ m s}^{-1} - 53.33 \text{ m s}^{-1}$
$v_{b/t} = 105 \text{ m s}^{-1}$
| Parameter | Value ($\text{m s}^{-1}$) |
|---|---|
| Velocity of Police Van ($v_p$) | $8.33$ |
| Velocity of Thief Car ($v_t$) | $53.33$ |
| Muzzle Velocity ($v_{b/p}$) | $150.00$ |
| Impact Speed ($v_{b/t}$) | $105.00$ |
Final Solution: The bullet hits the thief’s car with a relative speed of 105 m s$^{-1}$.
Solution:
To determine the average velocity, we must define the physical parameters provided:
[Definition: Average velocity $v_{avg} = \frac{\text{Total Displacement}}{\text{Total Time}}$]
First, calculate the time taken to reach the market ($t_1$):
$t_1 = \frac{d}{v_1} = \frac{2.5\text{ km}}{5\text{ km h}^{-1}} = 0.5\text{ hours}$
Convert to minutes: $0.5\text{ hours} \times 60\text{ min/hour} = 30\text{ minutes}$.
[Justification: Per the definition of uniform motion, $t = \frac{s}{v}$].
Since the man reaches the market exactly at $t = 30\text{ minutes}$, the position of the man at the end of the interval is the location of the market.
Applying the formula for average velocity:
$v_{avg} = \frac{\Delta x}{\Delta t} = \frac{2.5\text{ km}}{0.5\text{ h}} = 5\text{ km h}^{-1}$
Final Solution: The magnitude of the average velocity over the interval 0 to 30 minutes is $5\text{ km h}^{-1}$.
Solution:
The position-time graph depicts the movement of two children, A and B, starting from their school (at position $x = 0$) and moving towards their respective homes. The horizontal axis (t-axis) represents time, and the vertical axis (x-axis) represents the position from the school.
On the time axis (t-axis), the point of origin is $t = 0$. By observing the graph:
Since the time axis increases positively to the right [Per the Cartesian coordinate convention], a value of $t$ closer to the origin $O$ represents an earlier time.
Let $t_A$ be the starting time for child A and $t_B$ be the starting time for child B. From the graphical representation:
$t_A < t_B$
This inequality confirms that Child A initiates movement from the school at an earlier timestamp than Child B. [Justification: The x-intercept on the time axis represents the start time of the object's motion relative to the reference frame].
Applying the analytical observation to the given prompt:
Final Solution: A starts from the school earlier than B.
Solution:
To understand why the magnitude of instantaneous velocity is identical to instantaneous speed, we must define both in the limit of an infinitesimally small time interval, $\Delta t \to 0$.
Consider an object moving along a path. Let the position at time $t$ be $\vec{r}(t)$ and at time $t + \Delta t$ be $\vec{r}(t + \Delta t)$. The displacement vector is $\Delta \vec{r} = \vec{r}(t + \Delta t) - \vec{r}(t)$. [By definition of vector displacement].
As the time interval $\Delta t$ approaches zero, the segment of the path $\Delta s$ between the two positions becomes a straight line segment. [Per the Mean Value Theorem and the definition of a differentiable curve].
In this limit:
Taking the magnitude of the instantaneous velocity vector:
$$|\vec{v}| = \left| \lim_{\Delta t \to 0} \frac{\Delta \vec{r}}{\Delta t} \right|$$
Since the limit of the magnitude is the magnitude of the limit: [By the properties of limits in vector calculus]:
$$|\vec{v}| = \lim_{\Delta t \to 0} \frac{|\Delta \vec{r}|}{\Delta t}$$
Substituting $\Delta s$ for $|\Delta \vec{r}|$ as $\Delta t \to 0$:
$$|\vec{v}| = \lim_{\Delta t \to 0} \frac{\Delta s}{\Delta t} = \frac{ds}{dt} = v$$
The distinction between average speed and average velocity exists because average speed depends on the total path length (which can be curvilinear), while average velocity depends only on the net displacement (a straight line vector). Over finite intervals, the path length is always greater than or equal to the displacement magnitude. However, over an infinitesimal interval, the path is locally linear; therefore, the distance and displacement magnitude converge to identity.
Final Solution: The instantaneous speed is equal to the magnitude of instantaneous velocity because, in the limit $\Delta t \to 0$, the distance traveled along the path becomes indistinguishable from the straight-line displacement between the two points.
Solution:
The statement given is: "A particle in one-dimensional motion with zero speed may have non-zero velocity."
For any particle, the relationship between the magnitude of velocity ($|\vec{v}|$) and speed ($s$) is defined as:
$s = |\vec{v}|$
By mathematical implication, if the speed $s = 0$, then:
$0 = |\vec{v}|$
This equality necessitates that the magnitude of the velocity vector must be zero. For a vector to have a magnitude of zero, the vector itself must be the null vector ($\vec{v} = \vec{0}$).
The statement is False.
Reasoning: Speed is defined as the magnitude of the velocity vector. In one-dimensional motion, the velocity vector is $\vec{v} = v\hat{i}$ (where $\hat{i}$ is the unit vector along the line of motion). The magnitude of this velocity is $|v\hat{i}| = |v|$. If the speed ($|v|$) is zero, then $v$ must be zero. Consequently, the velocity must be zero. It is physically and mathematically impossible for a particle to be at rest (zero speed) while simultaneously moving (non-zero velocity) [Based on the axiomatic definition of speed as the magnitude of velocity].
Final Solution: The statement is False; zero speed implies that the magnitude of velocity is zero, which means the velocity vector must be zero.