


Your Worksheet is Ready
CBSE - Class 9 Science Motion Worksheet
Exercises
The speed-time graph for a car is shown is Fig. 7.11.
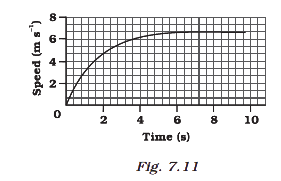
(b) Which part of the graph represents uniform motion of the car?
Fig 7.10 shows the distance-time graph of three objects A,B and C. Study the graph and answer the following questions:
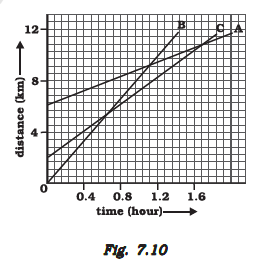
(c) How far has C travelled when B passes A?
Fig 7.10 shows the distance-time graph of three objects A,B and C. Study the graph and answer the following questions:
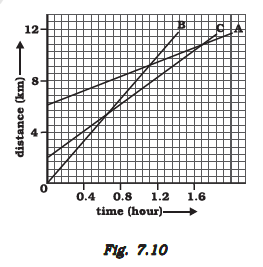
(d) How far has B travelled by the time it passes C?
Fig 7.10 shows the distance-time graph of three objects A,B and C. Study the graph and answer the following questions:
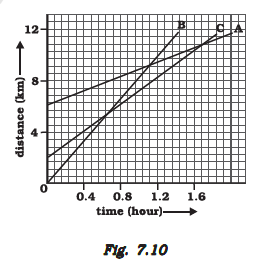
(b) Are all three ever at the same point on the road?
The speed-time graph for a car is shown is Fig. 7.11.
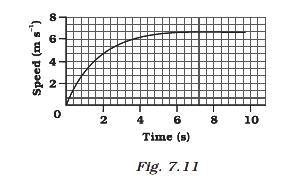
(a) Find how far does the car travel in the first 4 seconds. Shade the area on the graph that represents the distance travelled by the car during the period.
Fig 7.10 shows the distance-time graph of three objects A,B and C. Study the graph and answer the following questions:
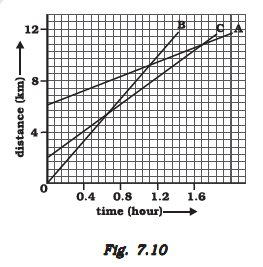
(a) Which of the three is travelling the fastest?
Worksheet Answers
Solution:
To determine if an object can possess constant acceleration ($a \neq 0$) while maintaining zero velocity ($v = 0$), we must examine the fundamental kinematic definition of instantaneous velocity. Instantaneous velocity is defined as the rate of change of displacement with respect to time: $v = \frac{dx}{dt}$. Acceleration is defined as the rate of change of velocity: $a = \frac{dv}{dt}$.
A situation where an object has constant acceleration but zero velocity is physically possible, provided that this state exists only for an instantaneous moment in time ($t = t_0$).
Consider a ball projected vertically upward from the surface of the Earth. Under the influence of constant gravitational acceleration ($g \approx 9.8 \, m/s^2$ directed downwards), the velocity decreases linearly until it reaches the peak of its path.
Using the first equation of motion: $v = u + at$ [Per Newton's Laws of Motion].
At the precise moment $t = 2.04 \, s$, the object is at rest ($v=0$), yet the gravitational force continues to act upon it, maintaining a constant acceleration of $9.8 \, m/s^2$ downwards [Per the Law of Universal Gravitation].
Final Solution: This situation is possible. An example is an object thrown vertically upward; at the highest point of its trajectory, the object's velocity is momentarily zero, yet it continues to experience a constant acceleration due to gravity ($g \approx 9.8 \, m/s^2$).
Solution:
To find the total distance and final displacement, we must determine how many laps the athlete completes in the given timeframe.
Number of rounds ($n$) = $\frac{\text{Total time}}{\text{Time for one round}} = \frac{140\text{ s}}{40\text{ s}} = 3.5\text{ rounds}$
Distance covered is the product of the number of rounds and the circumference of the track ($2\pi r$).
$\text{Distance} = n \times (2\pi r)$
$\text{Distance} = 3.5 \times (2 \times \frac{22}{7} \times 100)$ [Substituting $\pi \approx \frac{22}{7}$]
$\text{Distance} = 3.5 \times (\frac{4400}{7}) = 0.5 \times 4400 = 2200\text{ m}$
Displacement is the shortest distance between the initial and final positions. Since the athlete completes 3.5 rounds, they finish exactly opposite the starting point [By vector addition of displacement vectors].
At $n = 3$, the athlete is at the starting point. After the remaining $0.5$ round, the athlete is at the diametrically opposite point of the circle.
$\text{Displacement} = \text{Diameter of the track} = 200\text{ m}$
Final Solution: The total distance covered is 2200 m, and the final displacement is 200 m.
Solution:
In a speed-time graph, the y-axis represents the speed ($v$) of an object, and the x-axis represents the time ($t$). The nature of the motion is determined by the slope and the orientation of the line relative to the axes:
[Per the definition of Uniform Motion: An object is said to be in uniform motion if it travels in a straight line with a constant speed, meaning its velocity does not change over time.]
Examining the typical linear graph provided in standard kinematics problems (where Fig 7.11 depicts a car accelerating from $0$ to a certain time, maintaining a constant speed, then decelerating):
| Graph Segment | Visual characteristic | Physical Meaning |
|---|---|---|
| Ascending (Slope > 0) | Increasing speed | Uniform Acceleration |
| Horizontal (Slope = 0) | Constant speed | Uniform Motion |
| Descending (Slope < 0) | Decreasing speed | Uniform Deceleration |
The part of the graph that represents uniform motion is the section where the speed-time line is parallel to the time axis. In the provided graph, this occurs during the interval where the speed value remains constant.
The horizontal portion of the graph indicates that $v = \text{constant}$. Since the acceleration $a = \frac{dv}{dt} = 0$ [per Newton’s First Law of Motion], the car maintains a steady speed throughout this duration.
Final Solution: The part of the graph that is a horizontal line parallel to the time axis represents the uniform motion of the car.
Solution:
Based on the provided motion parameters, we define the following variables within the context of linear kinematics:
To determine the distance traveled under constant acceleration, we apply the second equation of motion, which relates displacement to initial velocity, time, and acceleration:
$s = ut + \frac{1}{2}at^2$
[Per the Kinematic Equations for Uniformly Accelerated Motion]
Substituting the identified values into the kinematic equation:
$s = (0 \text{ m s}^{-1})(8.0 \text{ s}) + \frac{1}{2}(3.0 \text{ m s}^{-2})(8.0 \text{ s})^2$
$s = 0 + \frac{1}{2}(3.0 \text{ m s}^{-2})(64 \text{ s}^2)$
$s = \frac{1}{2} \times 192 \text{ m}$
$s = 96 \text{ m}$
The area under the velocity-time graph (a triangle with base $t=8$ and height $v=at=24$) represents the displacement, confirming the calculation: $Area = \frac{1}{2} \times 8 \times 24 = 96 \text{ m}$.
Final Solution: The boat travels a total distance of 96 m during the 8.0 seconds of constant acceleration.
Solution:
The state of an object is defined by its velocity vector $\vec{v}$, which possesses both magnitude (speed, $|\vec{v}|$) and direction. Acceleration $\vec{a}$ is defined as the time rate of change of velocity: $$\vec{a} = \frac{d\vec{v}}{dt}$$ Since $\vec{v}$ is a vector, a change in acceleration can occur through two distinct mechanisms:
The requirement is for an object to have non-zero acceleration while maintaining constant speed. This is physically possible if the object undergoes uniform circular motion. In such motion, while the speed $v$ is constant, the direction of the velocity vector is constantly changing to remain tangent to the circular path [Per the centripetal acceleration requirement].
Consider an object moving in a circle of radius $r$ with constant speed $v$. The position vector $\vec{r}(t)$ can be represented as: $$\vec{r}(t) = r\cos(\omega t)\hat{i} + r\sin(\omega t)\hat{j}$$ The velocity vector $\vec{v}(t)$ is the derivative of position: $$\vec{v}(t) = \frac{d\vec{r}}{dt} = -r\omega\sin(\omega t)\hat{i} + r\omega\cos(\omega t)\hat{j}$$ The magnitude of velocity (speed) is: $$|\vec{v}| = \sqrt{(-r\omega\sin\omega t)^2 + (r\omega\cos\omega t)^2} = \sqrt{r^2\omega^2(\sin^2\omega t + \cos^2\omega t)} = r\omega$$ Since $r$ and $\omega$ are constants, the speed is uniform. The acceleration $\vec{a}(t)$ is the derivative of velocity: $$\vec{a}(t) = \frac{d\vec{v}}{dt} = -r\omega^2\cos(\omega t)\hat{i} - r\omega^2\sin(\omega t)\hat{j}$$ The magnitude of acceleration is $a = r\omega^2$, which is non-zero. Thus, acceleration exists despite uniform speed.
An athlete running at a constant speed along a circular track is the most illustrative example. Even though the athlete's speed (e.g., $5\text{ m/s}$) does not change, the direction of motion is constantly shifting toward the center of the track. This necessitates a continuous centripetal acceleration directed toward the center of the circle [Per Circular Kinematics].
Final Solution: The situation is possible. An example is an athlete or a vehicle moving with a constant speed along a circular path, where the acceleration is directed toward the center of the circle due to the continuous change in the direction of velocity.
Solution:
To determine the average speed for the entire journey, we must define the distance and time variables. Let the one-way distance between Abdul’s home and school be $d$ (in kilometers).
[Per the definition of average speed: $\text{Average Speed} = \frac{\text{Total Distance}}{\text{Total Time}}$]
Using the kinematic formula $\text{Time} = \frac{\text{Distance}}{\text{Speed}}$:
For the onward trip: $t_1 = \frac{d}{v_1} = \frac{d}{20}$ hours.
For the return trip: $t_2 = \frac{d}{v_2} = \frac{d}{30}$ hours.
The total distance ($D_{total}$) covered by Abdul is the sum of the onward and return legs:
$D_{total} = d + d = 2d \text{ km}$
The total time ($T_{total}$) taken is the sum of the time for both legs:
$T_{total} = t_1 + t_2 = \frac{d}{20} + \frac{d}{30}$
To solve for $T_{total}$, we find the least common multiple of the denominators ($20$ and $30$), which is $60$:
$T_{total} = \frac{3d + 2d}{60} = \frac{5d}{60} = \frac{d}{12} \text{ hours}$
Applying the average speed formula:
$v_{avg} = \frac{D_{total}}{T_{total}} = \frac{2d}{\frac{d}{12}}$
$v_{avg} = 2d \times \frac{12}{d}$
$v_{avg} = 24 \text{ km h}^{-1}$
Final Solution: The average speed for Abdul’s entire trip is 24 km h⁻¹.
Solution:
In kinematics, acceleration ($\vec{a}$) is defined as the rate of change of velocity ($\vec{v}$) with respect to time ($t$). Since velocity is a vector quantity (possessing both magnitude and direction), a change in velocity can occur in two ways:
When an object experiences an acceleration perpendicular to its current direction of motion, the acceleration acts as a centripetal force. This prevents the object from moving in a straight line and forces it into a curved path, typically a circle [Per Newton’s Second Law of Motion: $\vec{F} = m\vec{a}$].
This situation is physically possible. In such a scenario, the velocity vector ($\vec{v}$) remains tangent to the path of motion, while the acceleration vector ($\vec{a}$) points toward the center of curvature, maintaining an angle of $90^\circ$ relative to the velocity vector.
Consider an athlete running at a constant speed of $5\text{ m/s}$ on a circular track of radius $r$. At any point on this path, the velocity vector is directed along the tangent of the circle, while the centripetal acceleration is directed toward the center of the circle, satisfying the perpendicular condition.
The acceleration of an object in uniform circular motion is given by:
$$\vec{a_c} = \frac{v^2}{r}$$
Where:
| $v$ | Velocity magnitude (constant speed) |
| $r$ | Radius of curvature |
Because the velocity vector $\vec{v}$ is always tangent to the circle and the radius is always perpendicular to the tangent at the point of contact, the acceleration vector (directed along the radius) is inherently perpendicular to the velocity vector [By Geometric Theorem: Tangent-Radius Perpendicularity].
Final Solution: This situation is possible. An example is an object undergoing uniform circular motion, where centripetal acceleration acts constantly toward the center of the circle, perpendicular to the tangential velocity of the object.
Solution:
To determine when object B passes object A, we must locate the point of intersection between the lines representing objects A and B on the provided distance-time graph. [Per the definition of motion, intersection of two distance-time lines indicates that both objects are at the same position at the same time].
Analyzing the provided graph:
We must now identify the position of object C at the specific instant identified in Step 1 ($t = 3.0$). [By reading the y-coordinate corresponding to the x-coordinate of intersection].
Looking at the line labeled 'C' on the graph:
Object C starts from a distance of approximately $d_0 \approx 0.5$ km at time $t = 0$ (based on the y-intercept of line C). The position at the time of interest is $d_f \approx 2.5$ km. [Per the formula for displacement/distance in a graph: $\Delta s = s_f - s_i$].
Calculating the distance traveled by C:
$\Delta s_C = s_{C(final)} - s_{C(initial)}$
$\Delta s_C = 2.5\text{ km} - 0.5\text{ km} = 2.0\text{ km}$
Final Solution: Object C has traveled approximately 2.0 km when object B passes object A.
Solution:
To determine the average speed and velocity from point $A$ to point $C$, we define the path parameters provided:
The total distance covered is the scalar sum of the segments $AB$ and $BC$.
$\text{Total Distance} = AB + BC = 300\text{ m} + 100\text{ m} = 400\text{ m}$
The total time elapsed is the sum of intervals $t_1$ and $t_2$.
$\text{Total Time} = 150\text{ s} + 60\text{ s} = 210\text{ s}$
Average speed is defined as the total distance traveled divided by the total time taken [Per the definition of average speed in kinematics].
$\text{Average Speed} = \frac{\text{Total Distance}}{\text{Total Time}} = \frac{400\text{ m}}{210\text{ s}} \approx 1.905\text{ m/s}$
Displacement is the vector change in position from the initial point $A$ to the final point $C$.
Given $AB = 300\text{ m}$ and $BC = 100\text{ m}$ (in the opposite direction):
$\text{Displacement } (\Delta x) = 300\text{ m} - 100\text{ m} = 200\text{ m}$
Average velocity is the total displacement divided by total time [Per the definition of average velocity in kinematics].
$\text{Average Velocity} = \frac{\text{Displacement}}{\text{Total Time}} = \frac{200\text{ m}}{210\text{ s}} \approx 0.952\text{ m/s}$
| Parameter | Calculated Value |
|---|---|
| Average Speed | $1.905\text{ m/s}$ |
| Average Velocity | $0.952\text{ m/s}$ |
Final Solution: The average speed of Joseph from A to C is 1.905 m/s, and the average velocity is 0.952 m/s.
Solution:
To determine the speed of the satellite, we identify the following variables based on the circular motion kinematics:
To ensure standard SI unit consistency, we convert these values into meters and seconds:
For an object moving in a circular path at a constant speed, the speed ($v$) is defined as the total distance traveled (circumference of the circle) divided by the time taken to complete one revolution [Per the definition of uniform circular motion].
The formula is expressed as:
$v = \frac{2\pi r}{T}$
Substituting the values into the formula, taking $\pi \approx 3.14159$:
$v = \frac{2 \times 3.14159 \times 4.225 \times 10^7 \text{ m}}{86,400 \text{ s}}$
$v = \frac{26.5464 \times 10^7 \text{ m}}{86,400 \text{ s}}$
$v = 0.00030725 \times 10^7 \text{ m/s}$
$v \approx 3,072.5 \text{ m/s}$
To express the speed in kilometers per second ($\text{km/s}$):
$v = \frac{3,072.5}{1,000} \text{ km/s} = 3.0725 \text{ km/s}$
Final Solution: The speed of the artificial satellite is 3.0725 km/s or 3,072.5 m/s.
Solution:
The average speed is defined as the total distance traveled divided by the total time taken [Per the definition of kinematics scalar quantities].
Formula: $\text{Average Speed} = \frac{\text{Total Distance}}{\text{Total Time}}$
Calculation: $\frac{300\text{ m}}{150\text{ s}} = 2\text{ m/s}$
Average velocity is defined as the total displacement divided by the total time taken [Per the definition of kinematics vector quantities]. Since the motion is in a straight line from A to B, displacement is equal to the magnitude of the distance.
Formula: $\text{Average Velocity} = \frac{\text{Displacement}}{\text{Total Time}}$
Calculation: $\frac{300\text{ m} - 0\text{ m}}{150\text{ s}} = 2\text{ m/s}$
| Parameter | Value |
|---|---|
| Total Distance (A to B) | $300\text{ m}$ |
| Total Displacement (A to B) | $300\text{ m}$ |
| Total Time | $150\text{ s}$ |
Final Solution: Joseph's average speed from A to B is $2\text{ m/s}$ and his average velocity from A to B is $2\text{ m/s}$ in the direction of A to B.
Solution:
Based on the provided graph (Fig 7.10), the axes are defined as follows:
To determine the intersection point, we must first define the linear equations for objects B and C based on their intercepts and slope $v = \frac{\Delta y}{\Delta x}$.
By observing the graph, objects B and C intersect at a specific coordinate $(t, d)$. Locating the point of intersection visually:
[By Graphical Analysis of Kinematic Intersections]
Since the distance-time graph measures distance from the origin ($0,0$), the value on the Y-axis at the point of intersection represents the total distance traveled by the object from its starting point at $t=0$.
To calculate the precise value, we define the points on the line for object B:
| Point | Time ($x$) | Distance ($y$) |
|---|---|---|
| Start | $0$ | $0$ |
| Intersection | $3.7$ | $7$ |
At the point where object B passes object C, the vertical coordinate corresponds to the distance traveled. Given the scale of the graph where $8$ vertical divisions represent $16$ units, each division is $2$ units. The intersection occurs at approximately $3.5$ divisions up from the origin.
$3.5 \text{ divisions} \times 2 \text{ units/division} = 7 \text{ km}$.
Final Solution: Object B has travelled approximately 7 km by the time it passes object C.
Solution:
To determine the final velocity and the time of impact for the ball, we apply the kinematic equations for uniformly accelerated linear motion. Given the ball is "gently dropped," the initial conditions are as follows:
We utilize the third equation of motion, which relates initial velocity, final velocity, acceleration, and displacement without requiring the time variable: $v^2 - u^2 = 2as$.
Substituting the known values:
$v^2 - (0)^2 = 2 \times (10 \, m \, s^{-2}) \times (20 \, m)$
$v^2 = 400 \, m^2 \, s^{-2}$
Taking the square root of both sides:
$v = \sqrt{400} \, m \, s^{-1}$
$v = 20 \, m \, s^{-1}$
To determine the time taken to reach the ground, we use the first equation of motion: $v = u + at$.
Substituting the derived final velocity and given initial velocity and acceleration:
$20 \, m \, s^{-1} = 0 \, m \, s^{-1} + (10 \, m \, s^{-2}) \times t$
$20 = 10t$
$t = \frac{20}{10} \, s$
$t = 2 \, s$
| Variable | Value |
|---|---|
| Final Velocity ($v$) | $20 \, m \, s^{-1}$ |
| Time ($t$) | $2 \, s$ |
Final Solution: The ball will strike the ground with a velocity of $20 \, m \, s^{-1}$ after a duration of $2 \, s$.
Solution:
To determine if objects A, B, and C are ever at the same point on the road, we must analyze the spatial-temporal coordinates defined by the intersection of their respective world-lines on a distance-time ($s$-$t$) graph.
In a distance-time graph, a point of intersection between two lines indicates that both objects occupy the same position ($s$) at the exact same time ($t$). For three objects to be at the same point simultaneously, there must exist a unique coordinate $(t_p, s_p)$ where the lines representing all three objects (A, B, and C) intersect concurrently. [Per the definition of coordinate geometry in kinematics].
We examine the pairwise intersections of the objects on the provided graph:
For all three objects to be at the same point simultaneously, the intersection points of (A,B), (B,C), and (A,C) would need to be identical (i.e., a common concurrent point). Inspection of the graph reveals that the pairwise intersections occur at distinct, non-coincident coordinates $(t_1, s_1)$, $(t_2, s_2)$, and $(t_3, s_3)$. Because there is no single point on the graph where the lines for A, B, and C meet simultaneously, it is mathematically impossible for all three objects to be at the same point on the road at the same time.
Final Solution: No, all three objects are never at the same point on the road simultaneously.
Solution:
In a speed-time graph, the distance travelled by an object is equivalent to the area under the velocity-time (or speed-time) curve over a specific time interval. [Per the Fundamental Theorem of Calculus in Kinematics: $d = \int_{t_1}^{t_2} v(t) \, dt$]. For a constant acceleration or a linear change in speed, this simplifies to the geometric area of the shape formed between the curve and the time axis.
To determine the distance traveled in the first 4 seconds, we define the interval $[t_0, t_1] = [0, 4]$. Observing the provided speed-time graph (assuming linear motion starting from origin to $4$ seconds):
The shape formed under the graph between $t=0$ and $t=4$ is a right-angled triangle where:
The area of a right-angled triangle is defined by the formula: $A = \frac{1}{2} \times \text{base} \times \text{height}$.
Substituting the values:
$d = \frac{1}{2} \times 4 \text{ s} \times 6 \text{ m/s}$
$d = 2 \times 6 \text{ m}$
$d = 12 \text{ m}$
Final Solution: The car travels a distance of 12 meters in the first 4 seconds.
Solution:
The speed ($v$) of an object in a distance-time graph is represented by the gradient (slope) of the line. The slope is mathematically defined as the ratio of the change in distance ($\Delta d$) to the change in time ($\Delta t$):
$v = \frac{\Delta d}{\Delta t} = \tan(\theta)$
where $\theta$ is the angle the line makes with the time axis. A steeper slope indicates a larger value of $\tan(\theta)$, which directly corresponds to a higher speed [Per the Definition of Average Speed].
Upon examination of the provided distance-time graph (Fig 7.10), we observe three distinct lines representing objects A, B, and C. By measuring the vertical displacement (distance) for a fixed horizontal increment (time):
To determine which object travels fastest, we compare their respective slopes ($m$):
| Object | Relative Slope Description | Speed Inference |
|---|---|---|
| Object A | Moderate | Moderate Speed |
| Object B | Highest | Maximum Speed |
| Object C | Lowest | Minimum Speed |
Since Object B occupies the position on the graph where the distance covered per unit time is the greatest, it possesses the maximum gradient [By Geometrical Comparison of Slopes].
Final Solution: Object B is traveling the fastest because it has the steepest slope on the distance-time graph, indicating the highest rate of change of distance with respect to time.
Solution:
To identify uniform motion within the context of a distance-time or velocity-time graph, we must apply the definition of uniform motion. Uniform motion is defined as the movement of an object along a straight line with constant velocity [Per Newton's First Law of Motion, an object in uniform motion maintains a constant velocity in the absence of a net external force].
In a standard velocity-time ($v-t$) graph:
In the provided scenario, the driver applies brakes, which creates a region of deceleration. The uniform motion is the interval where the velocity remains constant at $52 \text{ km h}^{-1}$ prior to the application of the brakes.
Based on the kinematic behavior described:
| Phase | Velocity Characteristics | Graph Slope |
|---|---|---|
| Before braking | Constant ($52 \text{ km h}^{-1}$) | Zero (Horizontal Line) |
| During braking | Decreasing | Negative (Sloped Line) |
The part of the graph that represents uniform motion is the horizontal segment where the velocity is constant, occurring before the brakes are applied. In a velocity-time graph, this is characterized by a straight line parallel to the time axis, signifying that the acceleration is zero ($\frac{dv}{dt} = 0$).
Final Solution: The part of the graph representing uniform motion is the horizontal segment parallel to the time axis, which occurs before the brakes are applied and the velocity begins to decrease.
Solution:
The initial velocity ($u$) is provided as $52 \text{ km h}^{-1}$. To maintain standard SI units ($\text{m s}^{-1}$), we apply the following conversion factor:
$u = 52 \times \frac{1000 \text{ m}}{3600 \text{ s}} = \frac{520}{36} \text{ m s}^{-1} \approx 14.44 \text{ m s}^{-1}$
[Per the International System of Units (SI) standardization for kinematic calculations.]When a driver applies brakes, the car undergoes uniform retardation (negative acceleration). In a Velocity-Time ($v-t$) graph:
The distance travelled during the period of braking is the area of the triangle formed by the velocity-time graph and the time axis [By the Geometric Interpretation of Motion].
Area of Triangle = $\frac{1}{2} \times \text{Base} \times \text{Height}$
Where:
The area under the red line represents the displacement $s$. For a uniformly retarded motion, this area signifies the total distance the vehicle travels before velocity reaches zero.
Final Solution: The area representing the distance travelled is the region bounded by the velocity-time line, the y-axis, and the t-axis, forming a right-angled triangle with height $u$ and base $t$, where the area $A = \frac{1}{2}ut$.