
Your Worksheet is Ready
CBSE - Class 10 Mathematics Statistics Worksheet
EXERCISE 13.3
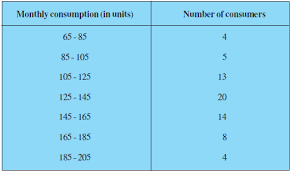
The following frequency distribution gives the monthly consumption of electricity of 68 consumers of a locality. Find the median, mean and mode of the data and compare them.
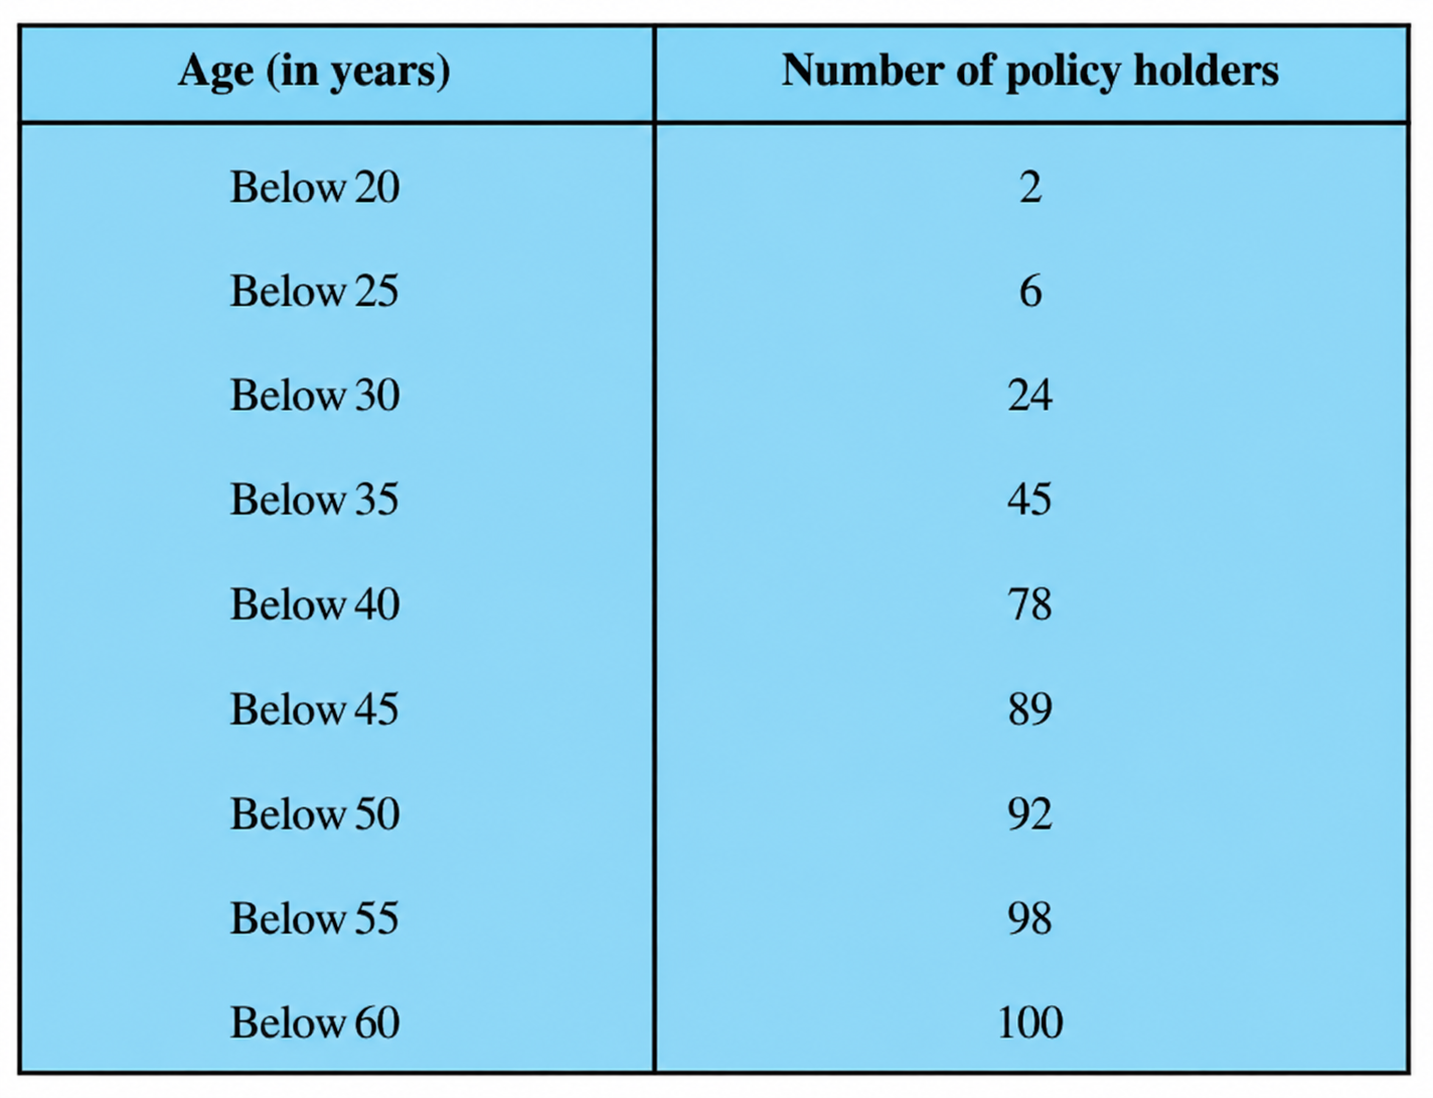
A life insurance agent found the following data for distribution of ages of 100 policy holders. Calculate the median age, if policies are given only to persons having age 18 years onwards but less than 60 year.
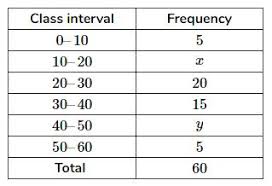
If the median of the distribution given below is 28.5, find the values of $x$ and $y$.
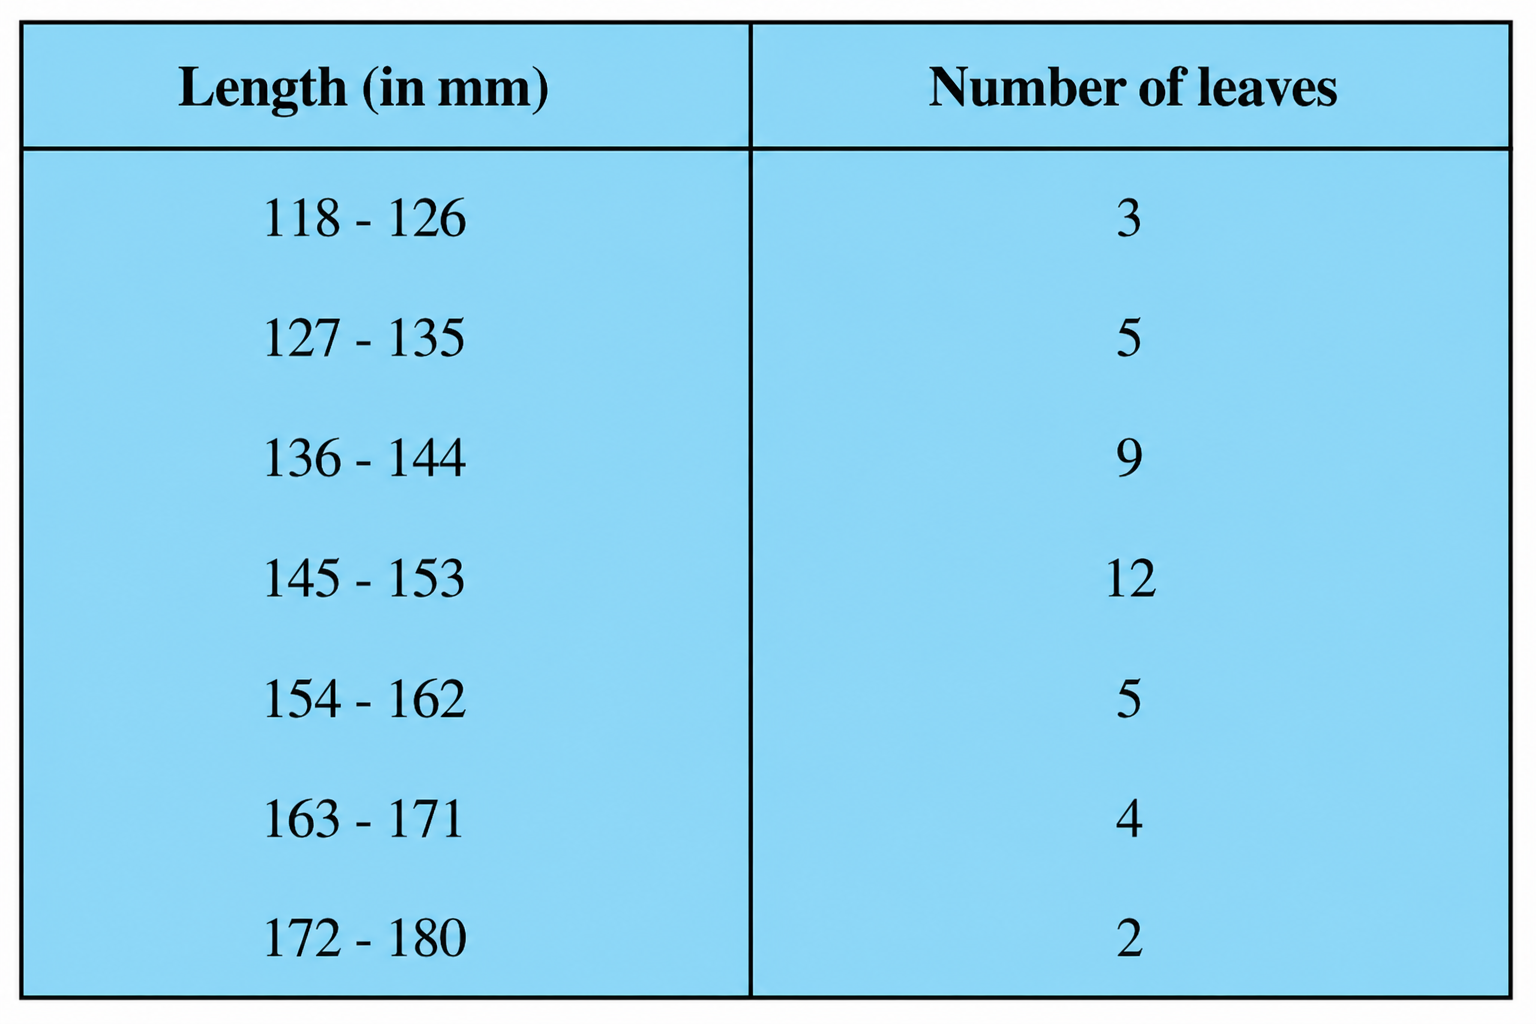
The lengths of 40 leaves of a plant are measured correct to the nearest millimetre, and the data obtained is represented in the following table :
Find the median length of the leaves. (Hint : The data needs to be converted to continuous classes for finding the median, since the formula assumes continuous classes. The classes then change to 117.5 - 126.5, 126.5 - 135.5, . . ., 171.5 - 180.5.)
The following table gives the distribution of the life time of 400 neon lamps :
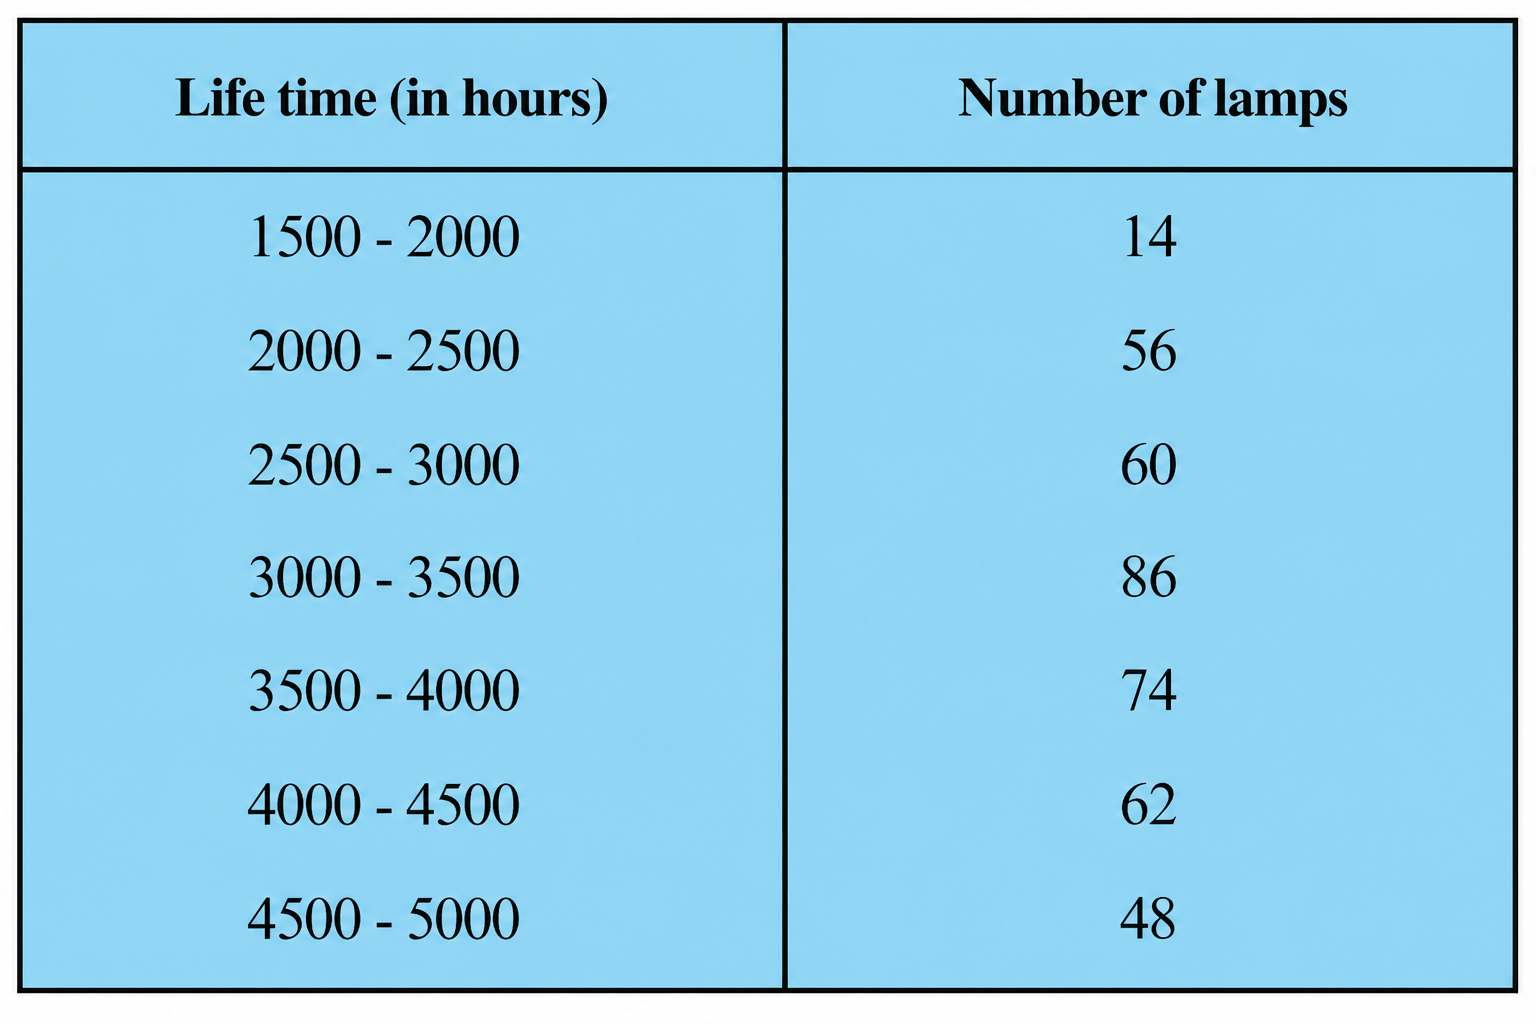
Find the median life time of a lamp.
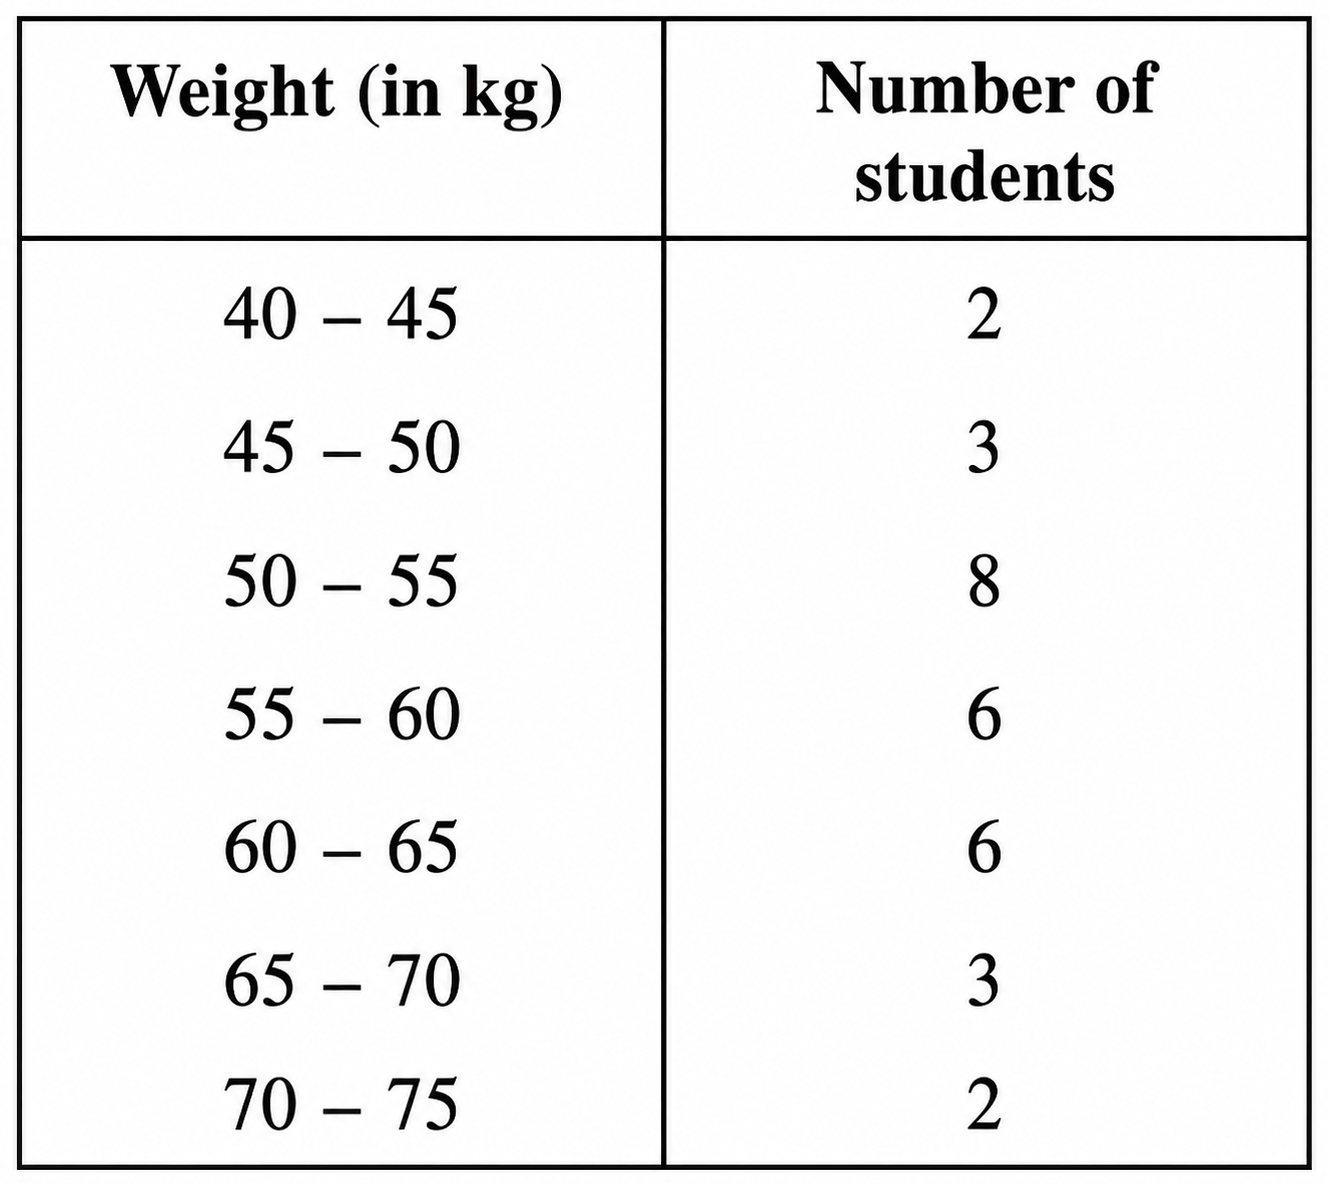
The distribution below gives the weights of 30 students of a class. Find the median weight of the students.
100 surnames were randomly picked up from a local telephone directory and the frequency distribution of the number of letters in the English alphabets in the surnames was obtained as follows:
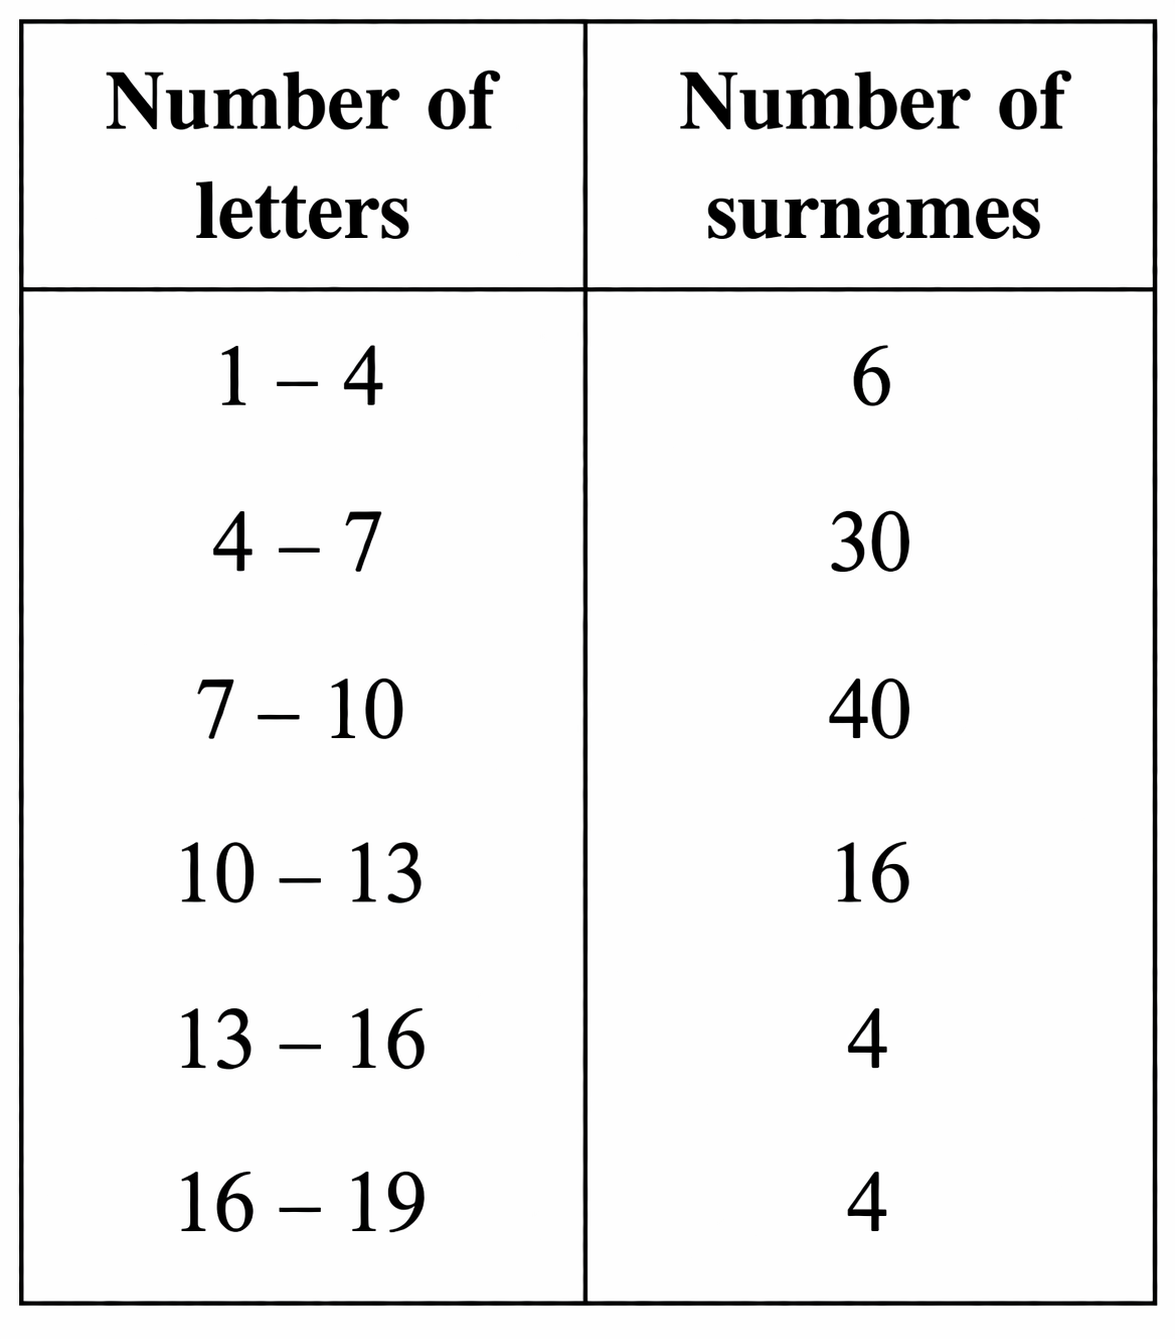
Determine the median number of letters in the surnames. Find the mean number of letters in the surnames? Also, find the modal size of the surnames.
Worksheet Answers
Solution:
Given: A frequency distribution table representing the monthly electricity consumption (in units) of 68 consumers.
| Monthly Consumption (units) | Number of Consumers ($f_i$) |
|---|---|
| 65 - 85 | 4 |
| 85 - 105 | 5 |
| 105 - 125 | 13 |
| 125 - 145 | 20 |
| 145 - 165 | 14 |
| 165 - 185 | 8 |
| 185 - 205 | 4 |
To Find: The Mean, Median, and Mode of the given data and compare them.
Step 1: Calculation of Mean ($\bar{x}$) using the Step-Deviation Method
Let the assumed mean $a = 135$. The class size $h = 20$.
| Class Interval | Frequency ($f_i$) | Class Mark ($x_i$) | $d_i = x_i - 135$ | $u_i = \frac{d_i}{20}$ | $f_i u_i$ |
|---|---|---|---|---|---|
| 65-85 | 4 | 75 | -60 | -3 | -12 |
| 85-105 | 5 | 95 | -40 | -2 | -10 |
| 105-125 | 13 | 115 | -20 | -1 | -13 |
| 125-145 | 20 | 135 | 0 | 0 | 0 |
| 145-165 | 14 | 155 | 20 | 1 | 14 |
| 165-185 | 8 | 175 | 40 | 2 | 16 |
| 185-205 | 4 | 195 | 60 | 3 | 12 |
| Total | $\sum f_i = 68$ | - | - | - | $\sum f_i u_i = 7$ |
Formula for Mean: $\bar{x} = a + \left( \frac{\sum f_i u_i}{\sum f_i} \right) \times h$
$\bar{x} = 135 + \left( \frac{7}{68} \right) \times 20 = 135 + \frac{140}{68} \approx 135 + 2.06 = 137.06$
Step 2: Calculation of Median
Cumulative Frequency ($cf$) table:
| Class Interval | Frequency ($f_i$) | Cumulative Frequency ($cf$) |
|---|---|---|
| 65-85 | 4 | 4 |
| 85-105 | 5 | 9 |
| 105-125 | 13 | 22 |
| 125-145 | 20 | 42 |
| 145-165 | 14 | 56 |
| 165-185 | 8 | 64 |
| 185-205 | 4 | 68 |
Here, $n = 68$, so $\frac{n}{2} = 34$. The cumulative frequency just greater than 34 is 42, which corresponds to the class 125-145.
Median Class = 125-145. Lower limit ($l$) = 125, $f = 20$, $cf$ of preceding class = 22, $h = 20$.
Median = $l + \left( \frac{\frac{n}{2} - cf}{f} \right) \times h = 125 + \left( \frac{34 - 22}{20} \right) \times 20 = 125 + 12 = 137$.
Step 3: Calculation of Mode
The maximum frequency is 20, which corresponds to the class 125-145. This is the Modal Class.
$l = 125, f_1 = 20, f_0 = 13, f_2 = 14, h = 20$.
Mode = $l + \left( \frac{f_1 - f_0}{2f_1 - f_0 - f_2} \right) \times h = 125 + \left( \frac{20 - 13}{2(20) - 13 - 14} \right) \times 20$
Mode = $125 + \left( \frac{7}{40 - 27} \right) \times 20 = 125 + \left( \frac{7}{13} \right) \times 20 = 125 + 10.77 = 135.77$.
Step 4: Comparison
Mean $\approx 137.06$, Median $= 137$, Mode $\approx 135.77$.
The values are very close to each other, indicating a nearly symmetric distribution.
Final Answer: Mean = 137.06 units, Median = 137 units, Mode = 135.77 units.
Solution:
Given: The frequency distribution of ages of 100 policy holders, provided as a cumulative frequency table (less than type):
| Age (years) | Number of policy holders (Cumulative Frequency) |
|---|---|
| Below 20 | 2 |
| Below 25 | 6 |
| Below 30 | 24 |
| Below 35 | 45 |
| Below 40 | 78 |
| Below 45 | 89 |
| Below 50 | 92 |
| Below 55 | 98 |
| Below 60 | 100 |
To Find: The median age of the policy holders.
Step 1: Convert the cumulative frequency distribution into a standard frequency distribution table.
To calculate the median, we need the class intervals and their corresponding frequencies ($f_i$).
| Class Interval | Frequency ($f_i$) | Cumulative Frequency ($cf$) |
|---|---|---|
| 15-20 | 2 | 2 |
| 20-25 | 6 - 2 = 4 | 6 |
| 25-30 | 24 - 6 = 18 | 24 |
| 30-35 | 45 - 24 = 21 | 45 |
| 35-40 | 78 - 45 = 33 | 78 |
| 40-45 | 89 - 78 = 11 | 89 |
| 45-50 | 92 - 89 = 3 | 92 |
| 50-55 | 98 - 92 = 6 | 98 |
| 55-60 | 100 - 98 = 2 | 100 |
| Total | $N = 100$ | - |
Step 2: Identify the median class.
The total number of observations is $N = 100$.
We calculate $\frac{N}{2} = \frac{100}{2} = 50$.
Looking at the cumulative frequency column, the first cumulative frequency greater than 50 is 78, which corresponds to the class interval 35-40.
Therefore, the median class is 35-40.
Step 3: Apply the Median Formula.
The formula for the median of a grouped frequency distribution is:
$\text{Median} = l + \left( \frac{\frac{N}{2} - cf}{f} \right) \times h$
Where:
Step 4: Perform the calculation.
Substitute the values into the formula:
$\text{Median} = 35 + \left( \frac{50 - 45}{33} \right) \times 5$
$\text{Median} = 35 + \left( \frac{5}{33} \right) \times 5$
$\text{Median} = 35 + \frac{25}{33}$
$\text{Median} = 35 + 0.7575...$
$\text{Median} \approx 35.76$
Final Answer: The median age of the policy holders is 35.76 years.
Solution:
Given: A frequency distribution table with a total frequency $N = 60$ and a median value of $28.5$.
| Class Interval | Frequency ($f$) |
|---|---|
| 0-10 | 5 |
| 10-20 | $x$ |
| 20-30 | 20 |
| 30-40 | 15 |
| 40-50 | $y$ |
| 50-60 | 5 |
| Total | 60 |
To find: The values of $x$ and $y$.
Step 1: Constructing the Cumulative Frequency Table
| Class Interval | Frequency ($f$) | Cumulative Frequency ($cf$) |
|---|---|---|
| 0-10 | 5 | 5 |
| 10-20 | $x$ | $5 + x$ |
| 20-30 | 20 | $25 + x$ |
| 30-40 | 15 | $40 + x$ |
| 40-50 | $y$ | $40 + x + y$ |
| 50-60 | 5 | $45 + x + y$ |
Step 2: Establishing the first linear equation
Since the total frequency is given as $60$, we have:
$45 + x + y = 60$Step 3: Identifying the Median Class
The median is given as $28.5$. Since $28.5$ lies between $20$ and $30$, the median class is $20-30$.
From the median class $20-30$:
Step 4: Applying the Median Formula
The formula for the median is: $\text{Median} = l + \left( \frac{\frac{N}{2} - cf}{f} \right) \times h$
Substituting the known values:
$28.5 = 20 + \left( \frac{30 - (5 + x)}{20} \right) \times 10$Step 5: Solving for $y$
Substitute $x = 8$ into Equation 1:
$8 + y = 15$Final Answer: The values are $x = 8$ and $y = 7$.
Solution:
Given: The frequency distribution of the lengths of 40 leaves measured to the nearest millimetre.
| Length (mm) | Number of leaves ($f$) |
|---|---|
| 118 - 126 | 3 |
| 127 - 135 | 5 |
| 136 - 144 | 9 |
| 145 - 153 | 12 |
| 154 - 162 | 5 |
| 163 - 171 | 4 |
| 172 - 180 | 2 |
To Find: The median length of the leaves.
Step 1: Converting to Continuous Classes
The given classes are discontinuous (e.g., 126 and 127). To make them continuous, we subtract 0.5 from the lower limit and add 0.5 to the upper limit of each class interval.
| Class Interval | Frequency ($f$) | Cumulative Frequency ($cf$) |
|---|---|---|
| 117.5 - 126.5 | 3 | 3 |
| 126.5 - 135.5 | 5 | 8 |
| 135.5 - 144.5 | 9 | 17 |
| 144.5 - 153.5 | 12 | 29 |
| 153.5 - 162.5 | 5 | 34 |
| 162.5 - 171.5 | 4 | 38 |
| 171.5 - 180.5 | 2 | 40 |
| Total | $n = 40$ | - |
Step 2: Identifying the Median Class
The total number of observations is $n = 40$.
We calculate $\frac{n}{2} = \frac{40}{2} = 20$.
Looking at the cumulative frequency column, the first cumulative frequency greater than 20 is 29, which corresponds to the class interval $144.5 - 153.5$.
Thus, the median class is $144.5 - 153.5$.
Step 3: Applying the Median Formula
The formula for the median is:
$\text{Median} = l + \left( \frac{\frac{n}{2} - cf}{f} \right) \times h$
Where:
$l$ (lower limit of median class) = $144.5$
$n$ (total number of observations) = $40$
$cf$ (cumulative frequency of the class preceding the median class) = $17$
$f$ (frequency of the median class) = $12$
$h$ (class size) = $153.5 - 144.5 = 9$
Step 4: Calculation
$\text{Median} = 144.5 + \left( \frac{20 - 17}{12} \right) \times 9$
$\text{Median} = 144.5 + \left( \frac{3}{12} \right) \times 9$
$\text{Median} = 144.5 + \left( \frac{1}{4} \right) \times 9$
$\text{Median} = 144.5 + 2.25$
$\text{Median} = 146.75$
Final Answer: The median length of the leaves is 146.75 mm.
Solution:
Given: The frequency distribution of the lifetime of 400 neon lamps as follows:
| Lifetime (hours) | Number of Lamps ($f_i$) |
|---|---|
| 1500 - 2000 | 14 |
| 2000 - 2500 | 56 |
| 2500 - 3000 | 60 |
| 3000 - 3500 | 86 |
| 3500 - 4000 | 74 |
| 4000 - 4500 | 62 |
| 4500 - 5000 | 48 |
To Find: The median lifetime of the neon lamps.
Step 1: Construct the Cumulative Frequency Table
To find the median, we first calculate the cumulative frequency ($cf$) for each class interval.
| Lifetime (hours) | Frequency ($f_i$) | Cumulative Frequency ($cf$) |
|---|---|---|
| 1500 - 2000 | 14 | 14 |
| 2000 - 2500 | 56 | 70 |
| 2500 - 3000 | 60 | 130 |
| 3000 - 3500 | 86 | 216 |
| 3500 - 4000 | 74 | 290 |
| 4000 - 4500 | 62 | 352 |
| 4500 - 5000 | 48 | 400 |
| Total | $N = 400$ | - |
Step 2: Identify the Median Class
The total number of observations is $N = 400$.
We calculate $\frac{N}{2} = \frac{400}{2} = 200$.
Looking at the cumulative frequency column, the first cumulative frequency greater than 200 is 216, which corresponds to the class interval $3000 - 3500$.
Therefore, the median class is $3000 - 3500$.
Step 3: Apply the Median Formula
The formula for the median of a grouped frequency distribution is:
$\text{Median} = l + \left( \frac{\frac{N}{2} - cf}{f} \right) \times h$
Where:
$l$ (lower limit of median class) = $3000$
$N$ (total frequency) = $400$
$cf$ (cumulative frequency of the class preceding the median class) = $130$
$f$ (frequency of the median class) = $86$
$h$ (class size) = $500$
Step 4: Perform the Calculation
Substitute the values into the formula:
$\text{Median} = 3000 + \left( \frac{200 - 130}{86} \right) \times 500$
$\text{Median} = 3000 + \left( \frac{70}{86} \right) \times 500$
$\text{Median} = 3000 + \left( \frac{35000}{86} \right)$ [Simplifying the fraction: $\frac{70}{86} = \frac{35}{43}$]
$\text{Median} = 3000 + 406.9767...$
$\text{Median} \approx 3406.98$
Final Answer: The median lifetime of a lamp is 3406.98 hours.
Solution:
Given: A frequency distribution of the weights of 30 students.
| Weight (kg) | Number of students (f) |
|---|---|
| 40 - 45 | 2 |
| 45 - 50 | 3 |
| 50 - 55 | 8 |
| 55 - 60 | 6 |
| 60 - 65 | 6 |
| 65 - 70 | 3 |
| 70 - 75 | 2 |
To Find: The median weight of the students.
Step 1: Constructing the Cumulative Frequency Table
To find the median, we must first calculate the cumulative frequency ($cf$) for each class interval.
| Weight (kg) | Frequency ($f$) | Cumulative Frequency ($cf$) |
|---|---|---|
| 40 - 45 | 2 | 2 |
| 45 - 50 | 3 | 2 + 3 = 5 |
| 50 - 55 | 8 | 5 + 8 = 13 |
| 55 - 60 | 6 | 13 + 6 = 19 |
| 60 - 65 | 6 | 19 + 6 = 25 |
| 65 - 70 | 3 | 25 + 3 = 28 |
| 70 - 75 | 2 | 28 + 2 = 30 |
| Total | $n = 30$ | - |
Step 2: Identifying the Median Class
The total number of observations is $n = 30$.
We calculate $\frac{n}{2} = \frac{30}{2} = 15$.
[The median class is the class interval whose cumulative frequency is greater than or nearest to $\frac{n}{2}$.]
Looking at the table, the cumulative frequency just greater than 15 is 19, which corresponds to the class interval 55 - 60.
Step 3: Applying the Median Formula
The formula for the median is:
$Median = l + \left( \frac{\frac{n}{2} - cf}{f} \right) \times h$
Where:
$l$ (lower limit of median class) = $55$
$n$ (total number of observations) = $30$
$cf$ (cumulative frequency of the class preceding the median class) = $13$
$f$ (frequency of the median class) = $6$
$h$ (class size) = $60 - 55 = 5$
Step 4: Calculating the Result
$Median = 55 + \left( \frac{15 - 13}{6} \right) \times 5$
$Median = 55 + \left( \frac{2}{6} \right) \times 5$
$Median = 55 + \left( \frac{1}{3} \right) \times 5$
$Median = 55 + \frac{5}{3}$
$Median = 55 + 1.666...$
$Median \approx 56.67$
Final Answer: The median weight of the students is 56.67 kg.
Solution:
Given: A frequency distribution of the number of letters in 100 surnames.
| Number of letters | Number of surnames ($f_i$) |
|---|---|
| 1 - 4 | 6 |
| 4 - 7 | 30 |
| 7 - 10 | 40 |
| 10 - 13 | 16 |
| 13 - 16 | 4 |
| 16 - 19 | 4 |
To Find: The Median, Mean, and Mode of the given data.
Step 1: Calculation of Mean ($\bar{x}$)
We use the Assumed Mean Method. Let the assumed mean $a = 11.5$. The class size $h = 3$.
| Class Interval | Frequency ($f_i$) | Class Mark ($x_i$) | $d_i = x_i - a$ | $u_i = \frac{x_i - a}{h}$ | $f_i u_i$ |
|---|---|---|---|---|---|
| 1-4 | 6 | 2.5 | -9 | -3 | -18 |
| 4-7 | 30 | 5.5 | -6 | -2 | -60 |
| 7-10 | 40 | 8.5 | -3 | -1 | -40 |
| 10-13 | 16 | 11.5 | 0 | 0 | 0 |
| 13-16 | 4 | 14.5 | 3 | 1 | 4 |
| 16-19 | 4 | 17.5 | 6 | 2 | 8 |
| Total | $\sum f_i = 100$ | - | - | - | $\sum f_i u_i = -106$ |
Formula for Mean: $\bar{x} = a + \left( \frac{\sum f_i u_i}{\sum f_i} \right) \times h$
$\bar{x} = 11.5 + \left( \frac{-106}{100} \right) \times 3 = 11.5 - 3.18 = 8.32$
Step 2: Calculation of Median
Total frequency $N = 100$. So, $N/2 = 50$.
| Class Interval | Frequency ($f_i$) | Cumulative Frequency ($cf$) |
|---|---|---|
| 1-4 | 6 | 6 |
| 4-7 | 30 | 36 |
| 7-10 | 40 | 76 |
The cumulative frequency just greater than 50 is 76, so the median class is $7-10$.
Lower limit ($l$) = 7, $cf$ of preceding class = 36, $f$ of median class = 40, $h = 3$.
Median = $l + \left( \frac{N/2 - cf}{f} \right) \times h = 7 + \left( \frac{50 - 36}{40} \right) \times 3 = 7 + \left( \frac{14}{40} \right) \times 3 = 7 + 1.05 = 8.05$
Step 3: Calculation of Mode
The modal class is the class with the highest frequency, which is $7-10$ ($f_1 = 40$).
$l = 7, f_1 = 40, f_0 = 30, f_2 = 16, h = 3$.
Mode = $l + \left( \frac{f_1 - f_0}{2f_1 - f_0 - f_2} \right) \times h = 7 + \left( \frac{40 - 30}{2(40) - 30 - 16} \right) \times 3$
Mode = $7 + \left( \frac{10}{80 - 46} \right) \times 3 = 7 + \left( \frac{10}{34} \right) \times 3 = 7 + 0.88 = 7.88$
Final Answer: The Mean number of letters is 8.32, the Median is 8.05, and the Mode is 7.88.
