
Your Worksheet is Ready
CBSE - Class 10 Mathematics Statistics Worksheet
EXERCISE 13.2
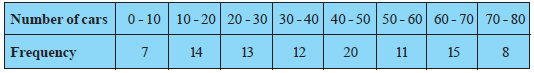
A student noted the number of cars passing through a spot on a road for 100 periods each of 3 minutes and summarised it in the table given below. Find the mode of the data:
The following table shows the ages of the patients admitted in a hospital during a year:
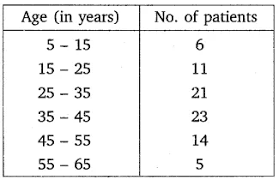
Find the mode and the mean of the data given above. Compare and interpret the two measures of central tendency.
The following data gives the information on the observed lifetimes (in hours) of 225 electrical components :
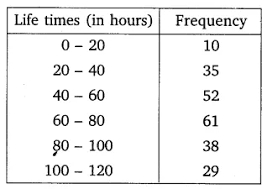
Determine the modal lifetimes of the components.
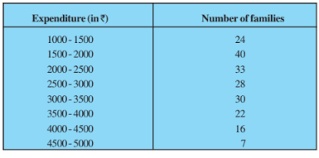
The following data gives the distribution of total monthly household expenditure of 200 families of a village. Find the modal monthly expenditure of the families. Also, find the mean monthly expenditure :
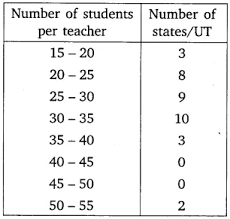
The following distribution gives the state-wise teacher-student ratio in higher secondary schools of India. Find the mode and mean of this data. Interpret the two measures.
The given distribution shows the number of runs scored by some top batsmen of the world in one-day international cricket matches.
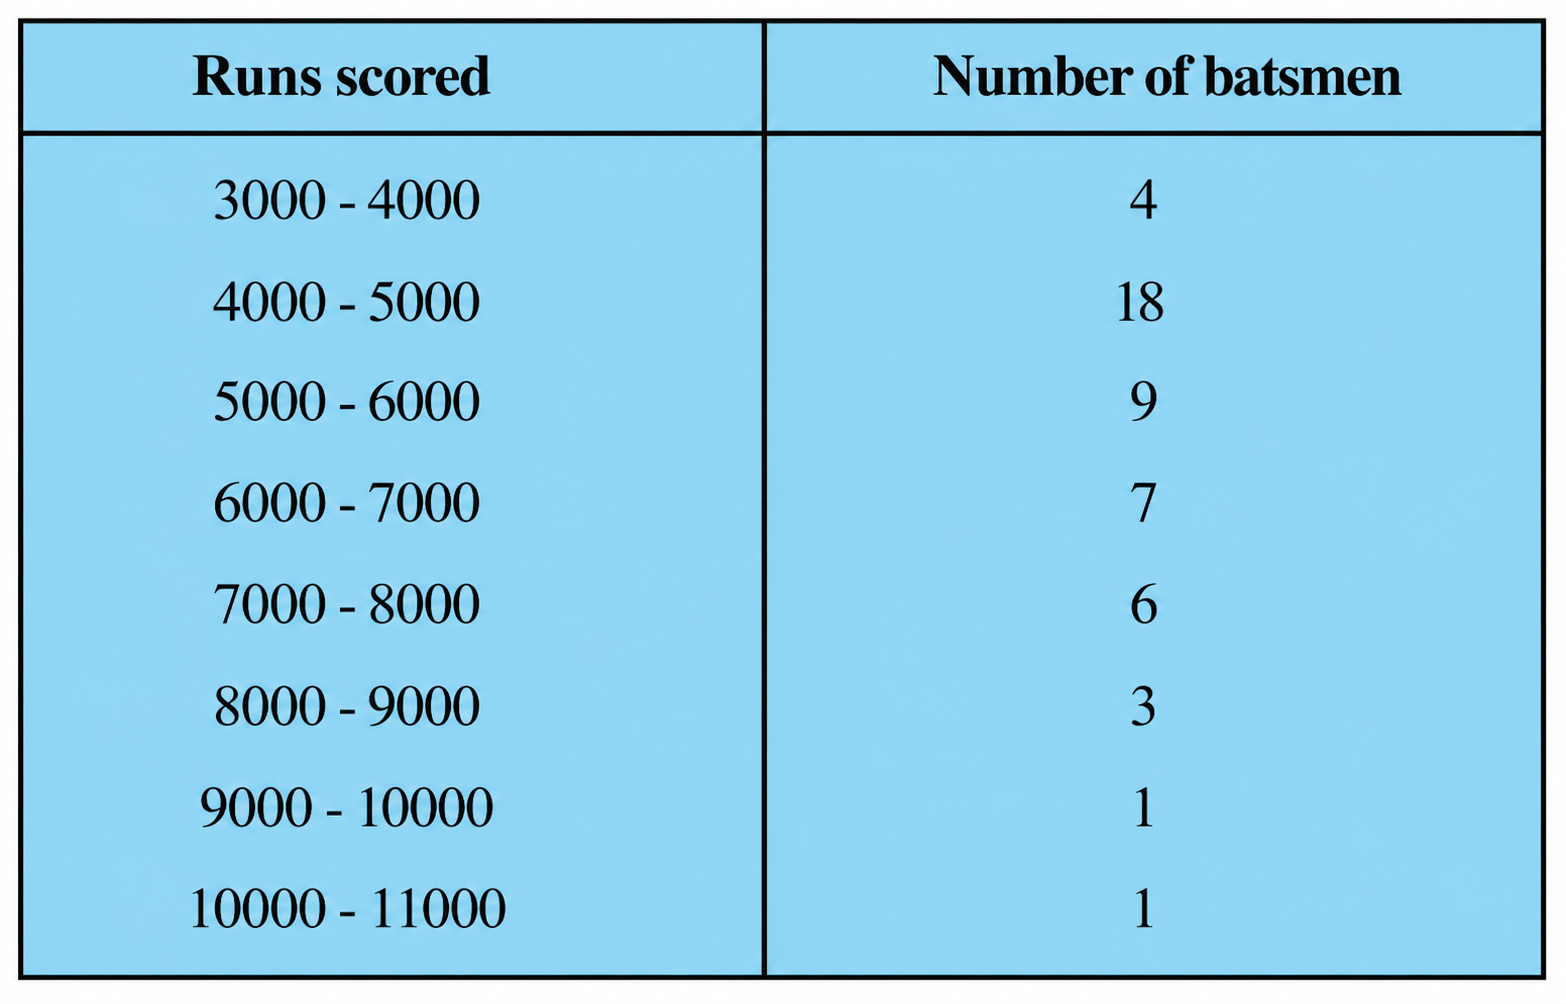
Find the mode of the data.
Worksheet Answers
Solution:
Given: A frequency distribution table representing the number of cars passing through a spot in 100 periods of 3 minutes each.
| Number of cars | Frequency ($f_i$) |
|---|---|
| 0 - 10 | 7 |
| 10 - 20 | 14 |
| 20 - 30 | 13 |
| 30 - 40 | 12 |
| 40 - 50 | 20 |
| 50 - 60 | 11 |
| 60 - 70 | 15 |
| 70 - 80 | 8 |
To find: The mode of the given grouped frequency distribution.
Step 1: Identify the Modal Class
The modal class is the class interval with the highest frequency. Observing the table, the highest frequency is $20$, which corresponds to the class interval $40 - 50$.
Therefore, the Modal Class is $40 - 50$.
Step 2: State the Formula for Mode
The formula for calculating the mode of grouped data is:
$\text{Mode} = l + \left( \frac{f_1 - f_0}{2f_1 - f_0 - f_2} \right) \times h$
Where:
Step 3: Extract the Variables
Based on the modal class $40 - 50$:
Step 4: Substitute and Calculate
Substituting the values into the formula:
$\text{Mode} = 40 + \left( \frac{20 - 12}{2(20) - 12 - 11} \right) \times 10$
$\text{Mode} = 40 + \left( \frac{8}{40 - 23} \right) \times 10$
$\text{Mode} = 40 + \left( \frac{8}{17} \right) \times 10$
$\text{Mode} = 40 + \frac{80}{17}$
Performing the division: $80 \div 17 \approx 4.7058...$
$\text{Mode} = 40 + 4.71$ (rounded to two decimal places)
$\text{Mode} = 44.71$
Final Answer: The mode of the data is 44.71 cars.
Solution:
Given: The frequency distribution of ages of patients admitted to a hospital:
| Age (in years) | 5-15 | 15-25 | 25-35 | 35-45 | 45-55 | 55-65 |
|---|---|---|---|---|---|---|
| Number of patients ($f_i$) | 6 | 11 | 21 | 23 | 14 | 5 |
To Find: The Mode and the Mean of the given data, and to compare and interpret the results.
Formula: $\text{Mode} = l + \left( \frac{f_1 - f_0}{2f_1 - f_0 - f_2} \right) \times h$
Where:
Step 1.1: Identify the Modal Class. The maximum frequency is $23$, which corresponds to the class interval $35-45$. Thus, the modal class is $35-45$.
Step 1.2: Assign values. $l = 35$, $f_1 = 23$, $f_0 = 21$, $f_2 = 14$, $h = 10$.
Step 1.3: Substitute into the formula.
$\text{Mode} = 35 + \left( \frac{23 - 21}{2(23) - 21 - 14} \right) \times 10$
$\text{Mode} = 35 + \left( \frac{2}{46 - 35} \right) \times 10 = 35 + \left( \frac{2}{11} \right) \times 10 = 35 + \frac{20}{11} \approx 35 + 1.818 = 36.82$
Step 2.1: Prepare the table for Assumed Mean Method ($A = 40$).
| Age | $f_i$ | Class Mark ($x_i$) | $d_i = x_i - 40$ | $f_i d_i$ |
|---|---|---|---|---|
| 5-15 | 6 | 10 | -30 | -180 |
| 15-25 | 11 | 20 | -20 | -220 |
| 25-35 | 21 | 30 | -10 | -210 |
| 35-45 | 23 | 40 | 0 | 0 |
| 45-55 | 14 | 50 | 10 | 140 |
| 55-65 | 5 | 60 | 20 | 100 |
| Total | 80 | - | - | -370 |
Step 2.2: Apply the Mean formula.
$\text{Mean} (\bar{x}) = A + \frac{\sum f_i d_i}{\sum f_i} = 40 + \left( \frac{-370}{80} \right) = 40 - 4.625 = 35.375$
The modal age is approximately $36.82$ years, representing the age group with the highest number of patients admitted. The mean age is $35.38$ years, representing the average age of all patients admitted. Since the mean is slightly less than the mode, it indicates that the distribution is slightly negatively skewed, but both measures suggest that the majority of patients admitted are in the mid-30s age range.
Final Answer: The Mode is 36.82 years and the Mean is 35.38 years.
Solution:
Given: The frequency distribution of the lifetimes (in hours) of 225 electrical components is as follows:
| Lifetimes (hours) | 0-20 | 20-40 | 40-60 | 60-80 | 80-100 | 100-120 |
|---|---|---|---|---|---|---|
| Frequency ($f_i$) | 10 | 35 | 52 | 61 | 38 | 29 |
To Find: The modal lifetime of the electrical components.
Step 1: Identifying the Modal Class
The modal class is the class interval with the highest frequency. Looking at the frequency distribution table, the highest frequency is $61$, which corresponds to the class interval $60-80$.
Therefore, the Modal Class is $60-80$.
Step 2: Stating the Formula for Mode
The formula for calculating the mode of a grouped frequency distribution is:
$\text{Mode} = l + \left( \frac{f_1 - f_0}{2f_1 - f_0 - f_2} \right) \times h$
Where:
$l$ = Lower limit of the modal class
$h$ = Size of the class interval
$f_1$ = Frequency of the modal class
$f_0$ = Frequency of the class preceding the modal class
$f_2$ = Frequency of the class succeeding the modal class
Step 3: Extracting the Values
From the given data:
$l = 60$
$h = 80 - 60 = 20$
$f_1 = 61$
$f_0 = 52$
$f_2 = 38$
Step 4: Substituting Values into the Formula
$\text{Mode} = 60 + \left( \frac{61 - 52}{2(61) - 52 - 38} \right) \times 20$
[Substituting the identified values into the formula]
Step 5: Performing the Arithmetic Calculations
$\text{Mode} = 60 + \left( \frac{9}{122 - 90} \right) \times 20$
$\text{Mode} = 60 + \left( \frac{9}{32} \right) \times 20$
$\text{Mode} = 60 + \left( \frac{180}{32} \right)$
$\text{Mode} = 60 + 5.625$
$\text{Mode} = 65.625$
Final Answer: The modal lifetime of the electrical components is 65.625 hours.
Solution:
Given: The frequency distribution of monthly household expenditure of 200 families.
| Expenditure (in ₹) | Number of Families ($f_i$) |
|---|---|
| 1000 - 1500 | 24 |
| 1500 - 2000 | 40 |
| 2000 - 2500 | 33 |
| 2500 - 3000 | 28 |
| 3000 - 3500 | 30 |
| 3500 - 4000 | 22 |
| 4000 - 4500 | 16 |
| 4500 - 5000 | 7 |
To Find: The Modal monthly expenditure and the Mean monthly expenditure.
Step 1: Identify the Modal Class. The modal class is the class interval with the highest frequency. Here, the highest frequency is $40$, which corresponds to the class interval $1500 - 2000$.
Step 2: Apply the Mode Formula. The formula for mode is: $Mode = l + \left( \frac{f_1 - f_0}{2f_1 - f_0 - f_2} \right) \times h$
Where:
$l$ (lower limit of modal class) = $1500$
$f_1$ (frequency of modal class) = $40$
$f_0$ (frequency of class preceding modal class) = $24$
$f_2$ (frequency of class succeeding modal class) = $33$
$h$ (class size) = $500$
Step 3: Calculation.
$Mode = 1500 + \left( \frac{40 - 24}{2(40) - 24 - 33} \right) \times 500$
$Mode = 1500 + \left( \frac{16}{80 - 57} \right) \times 500$
$Mode = 1500 + \left( \frac{16}{23} \right) \times 500$
$Mode = 1500 + \frac{8000}{23} \approx 1500 + 347.83 = 1847.83$
Step 1: Calculate Class Marks ($x_i$). $x_i = \frac{\text{Upper Limit} + \text{Lower Limit}}{2}$. Let assumed mean $a = 2750$.
| Expenditure | $f_i$ | $x_i$ | $d_i = x_i - 2750$ | $u_i = \frac{d_i}{500}$ | $f_i u_i$ |
|---|---|---|---|---|---|
| 1000-1500 | 24 | 1250 | -1500 | -3 | -72 |
| 1500-2000 | 40 | 1750 | -1000 | -2 | -80 |
| 2000-2500 | 33 | 2250 | -500 | -1 | -33 |
| 2500-3000 | 28 | 2750 | 0 | 0 | 0 |
| 3000-3500 | 30 | 3250 | 500 | 1 | 30 |
| 3500-4000 | 22 | 3750 | 1000 | 2 | 44 |
| 4000-4500 | 16 | 4250 | 1500 | 3 | 48 |
| 4500-5000 | 7 | 4750 | 2000 | 4 | 28 |
| Total | 200 | - | - | - | -35 |
Step 2: Apply the Step-Deviation Formula. $\bar{x} = a + \left( \frac{\sum f_i u_i}{\sum f_i} \right) \times h$
$\bar{x} = 2750 + \left( \frac{-35}{200} \right) \times 500$
$\bar{x} = 2750 + (-0.175 \times 500)$
$\bar{x} = 2750 - 87.5 = 2662.5$
Final Answer: The modal monthly expenditure is ₹1847.83 and the mean monthly expenditure is ₹2662.50.
Solution:
Given: The frequency distribution of the number of students per teacher in various states/UTs of India:
| Number of students per teacher | Number of states/U.T. ($f_i$) |
|---|---|
| 15 - 20 | 3 |
| 20 - 25 | 8 |
| 25 - 30 | 9 |
| 30 - 35 | 10 |
| 35 - 40 | 3 |
| 40 - 45 | 0 |
| 45 - 50 | 0 |
| 50 - 55 | 2 |
To Find: The Mode and the Mean of the given data and provide an interpretation.
Formula: $\text{Mode} = l + \left( \frac{f_1 - f_0}{2f_1 - f_0 - f_2} \right) \times h$
Where:
Step 1: Identify the Modal Class. The highest frequency is $10$, which corresponds to the class interval $30 - 35$. Thus, the modal class is $30 - 35$.
Step 2: Assign values. $l = 30$, $f_1 = 10$, $f_0 = 9$, $f_2 = 3$, $h = 5$.
Step 3: Substitute into the formula.
$\text{Mode} = 30 + \left( \frac{10 - 9}{2(10) - 9 - 3} \right) \times 5$
$\text{Mode} = 30 + \left( \frac{1}{20 - 12} \right) \times 5 = 30 + \frac{5}{8} = 30 + 0.625 = 30.625$
We use the Assumed Mean Method: $\bar{x} = a + \frac{\sum f_i d_i}{\sum f_i}$, where $d_i = x_i - a$. Let assumed mean $a = 32.5$.
| Class Interval | $f_i$ | Class mark ($x_i$) | $d_i = x_i - 32.5$ | $f_i d_i$ |
|---|---|---|---|---|
| 15-20 | 3 | 17.5 | -15 | -45 |
| 20-25 | 8 | 22.5 | -10 | -80 |
| 25-30 | 9 | 27.5 | -5 | -45 |
| 30-35 | 10 | 32.5 | 0 | 0 |
| 35-40 | 3 | 37.5 | 5 | 15 |
| 40-45 | 0 | 42.5 | 10 | 0 |
| 45-50 | 0 | 47.5 | 15 | 0 |
| 50-55 | 2 | 52.5 | 20 | 40 |
| Total | 35 | - | - | -115 |
Step 4: Calculate Mean.
$\bar{x} = 32.5 + \left( \frac{-115}{35} \right) = 32.5 - 3.2857 \approx 29.21$
The mode of $30.6$ indicates that the most common teacher-student ratio in the majority of states is approximately $30.6$. The mean of $29.2$ indicates that, on average, there are about $29$ students per teacher across the states.
Final Answer: Mode = 30.625, Mean = 29.21
Solution:
Given: The frequency distribution of runs scored by top batsmen in one-day international cricket matches is as follows:
| Runs Scored | Number of Batsmen ($f_i$) |
|---|---|
| 3000 - 4000 | 4 |
| 4000 - 5000 | 18 |
| 5000 - 6000 | 9 |
| 6000 - 7000 | 7 |
| 7000 - 8000 | 6 |
| 8000 - 9000 | 3 |
| 9000 - 10000 | 1 |
| 10000 - 11000 | 1 |
To Find: The mode of the given grouped frequency distribution.
Step 1: Identify the Modal Class
The modal class is the class interval with the highest frequency. Looking at the table, the highest frequency is $18$, which corresponds to the class interval $4000 - 5000$.
Therefore, the Modal Class is $4000 - 5000$.
Step 2: State the Formula for Mode
The formula for calculating the mode of grouped data is:
$\text{Mode} = l + \left( \frac{f_1 - f_0}{2f_1 - f_0 - f_2} \right) \times h$
Where:
$l$ = Lower limit of the modal class
$h$ = Size of the class interval
$f_1$ = Frequency of the modal class
$f_0$ = Frequency of the class preceding the modal class
$f_2$ = Frequency of the class succeeding the modal class
Step 3: Assign Values to Variables
From the distribution:
$l = 4000$
$h = 5000 - 4000 = 1000$
$f_1 = 18$
$f_0 = 4$
$f_2 = 9$
Step 4: Substitute Values into the Formula
$\text{Mode} = 4000 + \left( \frac{18 - 4}{2(18) - 4 - 9} \right) \times 1000$
$\text{Mode} = 4000 + \left( \frac{14}{36 - 13} \right) \times 1000$
$\text{Mode} = 4000 + \left( \frac{14}{23} \right) \times 1000$
$\text{Mode} = 4000 + \frac{14000}{23}$
Step 5: Perform the Arithmetic Calculation
Dividing $14000$ by $23$:
$14000 \div 23 \approx 608.6956...$
Rounding to two decimal places, we get $608.70$.
$\text{Mode} = 4000 + 608.70$
$\text{Mode} = 4608.70$
Final Answer: The mode of the given data is 4608.7 runs.
