


Your Worksheet is Ready
CBSE - Class 11 Mathematics Statistics Worksheet
Find the mean deviation about the mean for the data:

Find the mean and variance for the data:

Find the mean deviation about the mean for the data:

Find the mean deviation about median for the following data:

Find the mean and variance for the following frequency distribution:

Find the mean and standard deviation using short-cut method.

Find the mean and variance for the data:
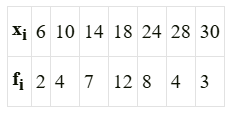
Find the mean and variance for the following frequency distribution:

Worksheet Answers
Solution:
Let the eight observations be $x_1, x_2, x_3, x_4, x_5, x_6, x_7,$ and $x_8$. Given the known observations: $x_1=6, x_2=7, x_3=10, x_4=12, x_5=12, x_6=13$. Let the two unknown observations be $a$ and $b$. The total number of observations $n = 8$.
The formula for the mean ($\bar{x}$) is $\bar{x} = \frac{\sum_{i=1}^{n} x_i}{n}$. [Per the definition of Arithmetic Mean]. Given $\bar{x} = 9$ and $n = 8$: $9 = \frac{6 + 7 + 10 + 12 + 12 + 13 + a + b}{8}$ $72 = 60 + a + b$ $a + b = 12$ --- (Equation 1)
The formula for variance ($\sigma^2$) is $\sigma^2 = \frac{\sum x_i^2}{n} - (\bar{x})^2$. [Per the computational formula for Variance]. Given $\sigma^2 = 9.25$ and $\bar{x} = 9$: $9.25 = \frac{6^2 + 7^2 + 10^2 + 12^2 + 12^2 + 13^2 + a^2 + b^2}{8} - (9)^2$ $9.25 = \frac{36 + 49 + 100 + 144 + 144 + 169 + a^2 + b^2}{8} - 81$ $90.25 = \frac{642 + a^2 + b^2}{8}$ $722 = 642 + a^2 + b^2$ $a^2 + b^2 = 80$ --- (Equation 2)
From Equation 1, $b = 12 - a$. Substitute this into Equation 2: $a^2 + (12 - a)^2 = 80$ $a^2 + 144 - 24a + a^2 = 80$ $2a^2 - 24a + 64 = 0$ Divide by 2: $a^2 - 12a + 32 = 0$ Factorizing the quadratic equation: $(a - 8)(a - 4) = 0$ Thus, $a = 8$ or $a = 4$. If $a = 8$, then $b = 12 - 8 = 4$. If $a = 4$, then $b = 12 - 4 = 8$.
Final Solution: The remaining two observations are 4 and 8.
Solution:
To find the mean deviation about the mean, we first define the given frequency distribution where $x_i$ represents the variable and $f_i$ represents the corresponding frequency.
| $x_i$ | $f_i$ | $f_i x_i$ |
|---|---|---|
| 10 | 4 | 40 |
| 30 | 24 | 720 |
| 50 | 28 | 1400 |
| 70 | 16 | 1120 |
| 90 | 8 | 720 |
| Total | $\sum f_i = 80$ | $\sum f_i x_i = 4000$ |
The mean ($\bar{x}$) is calculated using the formula: $\bar{x} = \frac{\sum f_i x_i}{\sum f_i}$ [By the definition of Arithmetic Mean for grouped data].
$\bar{x} = \frac{4000}{80} = 50$.
The Mean Deviation about the mean ($MD(\bar{x})$) is given by the formula: $MD(\bar{x}) = \frac{\sum f_i |x_i - \bar{x}|}{\sum f_i}$.
| $x_i$ | $f_i$ | $|x_i - \bar{x}|$ | $f_i |x_i - \bar{x}|$ |
|---|---|---|---|
| 10 | 4 | $|10-50| = 40$ | 160 |
| 30 | 24 | $|30-50| = 20$ | 480 |
| 50 | 28 | $|50-50| = 0$ | 0 |
| 70 | 16 | $|70-50| = 20$ | 320 |
| 90 | 8 | $|90-50| = 40$ | 320 |
| Total | 80 | - | $\sum f_i |x_i - \bar{x}| = 1280$ |
Substitute the values into the Mean Deviation formula:
$MD(\bar{x}) = \frac{1280}{80}$
$MD(\bar{x}) = 16$.
Final Solution: The mean deviation about the mean for the given data is 16.
Solution:
The provided data consists of class intervals and their corresponding frequencies. We represent the midpoint of each class interval as $x_i$ and the frequency as $f_i$.
| Class Interval | Frequency ($f_i$) | Midpoint ($x_i$) | $f_i x_i$ | $x_i^2$ | $f_i x_i^2$ |
|---|---|---|---|---|---|
| 10-20 | 2 | 15 | 30 | 225 | 450 |
| 20-30 | 3 | 25 | 75 | 625 | 1875 |
| 30-40 | 5 | 35 | 175 | 1225 | 6125 |
| 40-50 | 10 | 45 | 450 | 2025 | 20250 |
| 50-60 | 3 | 55 | 165 | 3025 | 9075 |
| 60-70 | 5 | 65 | 325 | 4225 | 21125 |
| 70-80 | 2 | 75 | 150 | 5625 | 11250 |
| Total | $\sum f_i = 30$ | - | $\sum f_i x_i = 1370$ | - | $\sum f_i x_i^2 = 70150$ |
The mean is calculated using the formula: $\bar{x} = \frac{\sum f_i x_i}{\sum f_i}$ [Definition of Arithmetic Mean for Grouped Data].
Substituting the values from the table:
$\bar{x} = \frac{1370}{30} = 45.67$
The variance is determined using the formula: $\sigma^2 = \frac{1}{N} \sum f_i x_i^2 - (\bar{x})^2$, where $N = \sum f_i$ [Computational Formula for Variance].
Substitute the calculated sums:
$\sigma^2 = \frac{70150}{30} - (45.67)^2$
$\sigma^2 = 2338.33 - 2085.75$
$\sigma^2 = 252.58$
Final Solution: The Mean ($\bar{x}$) is $45.67$ and the Variance ($\sigma^2$) is $252.58$.
Solution:
To find the mean deviation about the mean, we first represent the given frequency distribution. The data is provided as follows:
| $x_i$ | $f_i$ | $f_i \cdot x_i$ |
|---|---|---|
| 6 | 4 | 24 |
| 7 | 3 | 21 |
| 8 | 2 | 16 |
| 9 | 9 | 81 |
| 10 | 5 | 50 |
| 11 | 6 | 66 |
| 12 | 3 | 36 |
| 13 | 8 | 104 |
| Total | $N = \sum f_i = 40$ | $\sum f_i x_i = 398$ |
The mean ($\bar{x}$) is calculated using the formula: $\bar{x} = \frac{\sum f_i x_i}{\sum f_i}$ [By Definition of Arithmetic Mean].
$\bar{x} = \frac{398}{40} = 9.95$
We now calculate the absolute deviation $|x_i - \bar{x}|$ for each observation and multiply by the corresponding frequency $f_i$.
| $x_i$ | $f_i$ | $|x_i - 9.95|$ | $f_i |x_i - 9.95|$ |
|---|---|---|---|
| 6 | 4 | 3.95 | 15.8 |
| 7 | 3 | 2.95 | 8.85 |
| 8 | 2 | 1.95 | 3.9 |
| 9 | 9 | 0.95 | 8.55 |
| 10 | 5 | 0.05 | 0.25 |
| 11 | 6 | 1.05 | 6.3 |
| 12 | 3 | 2.05 | 6.15 |
| 13 | 8 | 3.05 | 24.4 |
| Total | 40 | - | 74.2 |
The Mean Deviation ($MD$) is defined as the average of the absolute deviations from the mean [Statistical Formula for M.D.]:
$MD(\bar{x}) = \frac{\sum f_i |x_i - \bar{x}|}{\sum f_i}$
$MD(\bar{x}) = \frac{74.2}{40}$
$MD(\bar{x}) = 1.855$
Final Solution: The Mean Deviation about the Mean is 1.855.
Solution:
The provided data consists of a frequency distribution. We define the variable $x_i$ as the class mark (mid-point of the class intervals) and $f_i$ as the corresponding frequency.
| Class Interval | Frequency ($f_i$) | Class Mark ($x_i$) | $f_i x_i$ | Cumulative Frequency ($c.f.$) |
|---|---|---|---|---|
| 0-10 | 6 | 5 | 30 | 6 |
| 10-20 | 7 | 15 | 105 | 13 |
| 20-30 | 15 | 25 | 375 | 28 |
| 30-40 | 16 | 35 | 560 | 44 |
| 40-50 | 4 | 45 | 180 | 48 |
| Total | $N = 48$ | - | - | - |
The total frequency $N = 48$. The median class is determined by $\frac{N}{2} = \frac{48}{2} = 24$.
Looking at the cumulative frequency column, the value 24 falls within the class interval 20-30. [Per the definition of Median for grouped data].
Formula: $M = l + \left( \frac{\frac{N}{2} - cf}{f} \right) \times h$
$M = 20 + \left( \frac{24 - 13}{15} \right) \times 10 = 20 + \left( \frac{11}{15} \right) \times 10 = 20 + \frac{110}{15} = 20 + 7.33 = 27.33$
The formula for Mean Deviation is $MD(M) = \frac{\sum f_i |x_i - M|}{N}$.
| $x_i$ | $f_i$ | $|x_i - 27.33|$ | $f_i |x_i - 27.33|$ |
|---|---|---|---|
| 5 | 6 | 22.33 | 133.98 |
| 15 | 7 | 12.33 | 86.31 |
| 25 | 15 | 2.33 | 34.95 |
| 35 | 16 | 7.67 | 122.72 |
| 45 | 4 | 17.67 | 70.68 |
| Total | 48 | - | 448.64 |
$MD(M) = \frac{448.64}{48} \approx 9.3466$
Final Solution: The mean deviation about the median is $9.35$.
Solution:
The given data set is: $13, 17, 16, 14, 11, 13, 10, 16, 11, 18, 12, 17$.
First, we arrange the observations in ascending order: $10, 11, 11, 12, 13, 13, 14, 16, 16, 17, 17, 18$.
The total number of observations $n = 12$. [By definition, $n$ is even].
For an even number of observations, the median is the arithmetic mean of the $(\frac{n}{2})^{th}$ and $(\frac{n}{2} + 1)^{th}$ terms. [Per the definition of Median for grouped/ungrouped discrete data].
Median ($M$) = $\frac{13 + 14}{2} = \frac{27}{2} = 13.5$.
We calculate the absolute deviations $|x_i - M|$ for each $x_i$, where $M = 13.5$.
| $x_i$ | $|x_i - 13.5|$ |
|---|---|
| 10 | 3.5 |
| 11 | 2.5 |
| 11 | 2.5 |
| 12 | 1.5 |
| 13 | 0.5 |
| 13 | 0.5 |
| 14 | 0.5 |
| 16 | 2.5 |
| 16 | 2.5 |
| 17 | 3.5 |
| 17 | 3.5 |
| 18 | 4.5 |
$\sum |x_i - M| = 3.5 + 2.5 + 2.5 + 1.5 + 0.5 + 0.5 + 0.5 + 2.5 + 2.5 + 3.5 + 3.5 + 4.5$
$\sum |x_i - M| = 28$
Mean Deviation about Median ($MD_M$) is given by the formula: $MD_M = \frac{\sum |x_i - M|}{n}$. [Per the statistical formula for Mean Deviation].
$MD_M = \frac{28}{12} = \frac{7}{3} \approx 2.333$
Final Solution: The mean deviation about the median is $2.33$ (or $\frac{7}{3}$).
Solution:
Given the data set: $x_i = \{6, 7, 10, 12, 13, 4, 8, 12\}$. The number of observations is $n = 8$.
The arithmetic mean ($\bar{x}$) is defined by the formula: $\bar{x} = \frac{1}{n} \sum_{i=1}^{n} x_i$ [Definition of Arithmetic Mean].
Calculation of the sum of observations ($\sum x_i$):
$6 + 7 + 10 + 12 + 13 + 4 + 8 + 12 = 72$
Calculating the mean:
$\bar{x} = \frac{72}{8} = 9$
The variance ($\sigma^2$) is defined as: $\sigma^2 = \frac{1}{n} \sum_{i=1}^{n} (x_i - \bar{x})^2$ [Variance Formula].
| $x_i$ | $x_i - \bar{x}$ ($x_i - 9$) | $(x_i - \bar{x})^2$ |
|---|---|---|
| 6 | -3 | 9 |
| 7 | -2 | 4 |
| 10 | 1 | 1 |
| 12 | 3 | 9 |
| 13 | 4 | 16 |
| 4 | -5 | 25 |
| 8 | -1 | 1 |
| 12 | 3 | 9 |
| Sum | 0 | 74 |
Sum of squared deviations: $\sum_{i=1}^{8} (x_i - 9)^2 = 74$.
Variance ($\sigma^2$):
$\sigma^2 = \frac{1}{8} \times 74$
$\sigma^2 = 9.25$
Final Solution: The Mean ($\bar{x}$) is $9$ and the Variance ($\sigma^2$) is $9.25$.
Solution:
Given the initial set of $n_1 = 100$ observations:
The relationship for the sum of observations ($\sum x_i$) is defined by $\bar{x} = \frac{\sum x_i}{n}$. [Per the definition of Arithmetic Mean]
$\sum x_i = n_1 \times \bar{x}_1 = 100 \times 20 = 2000$.
The relationship for variance ($\sigma^2$) is $\sigma^2 = \frac{\sum x_i^2}{n} - (\bar{x})^2$. [Per the Computational Formula for Variance]
$\sigma_1^2 = 3^2 = 9$. Thus, $9 = \frac{\sum x_i^2}{100} - (20)^2$.
$\sum x_i^2 = 100 \times (9 + 400) = 40900$.
The incorrect observations to be removed are $21, 21, 18$. The number of remaining observations is $n_2 = 100 - 3 = 97$.
New sum of observations ($\sum x_{new}$):
$\sum x_{new} = 2000 - (21 + 21 + 18) = 2000 - 60 = 1940$.
New sum of squares ($\sum x_{new}^2$):
$\sum x_{new}^2 = 40900 - (21^2 + 21^2 + 18^2) = 40900 - (441 + 441 + 324) = 40900 - 1206 = 39694$.
New Mean ($\bar{x}_2$):
$\bar{x}_2 = \frac{\sum x_{new}}{n_2} = \frac{1940}{97} = 20$.
New Variance ($\sigma_2^2$):
$\sigma_2^2 = \frac{\sum x_{new}^2}{n_2} - (\bar{x}_2)^2$
$\sigma_2^2 = \frac{39694}{97} - (20)^2 \approx 409.2165 - 400 = 9.2165$.
New Standard Deviation ($\sigma_2$):
$\sigma_2 = \sqrt{9.2165} \approx 3.036$.
Final Solution: The new mean is $20$ and the new standard deviation is approximately $3.036$.
Solution:
To calculate the mean and variance for the given frequency distribution, we first construct a frequency table using the class intervals ($x_i$ represent the midpoints of the classes).
| Class Interval | Frequency ($f_i$) | Midpoint ($x_i$) | $f_i x_i$ | $x_i^2$ | $f_i x_i^2$ |
|---|---|---|---|---|---|
| 0 - 30 | 2 | 15 | 30 | 225 | 450 |
| 30 - 60 | 3 | 45 | 135 | 2025 | 6075 |
| 60 - 90 | 5 | 75 | 375 | 5625 | 28125 |
| 90 - 120 | 10 | 105 | 1050 | 11025 | 110250 |
| 120 - 150 | 3 | 135 | 405 | 18225 | 54675 |
| 150 - 180 | 5 | 165 | 825 | 27225 | 136125 |
| 180 - 210 | 2 | 195 | 390 | 38025 | 76075 |
| Total | $\sum f_i = 30$ | - | $\sum f_i x_i = 3210$ | - | $\sum f_i x_i^2 = 411775$ |
The mean of a grouped frequency distribution is calculated by the formula [Per the definition of arithmetic mean for grouped data]:
$\bar{x} = \frac{\sum f_i x_i}{\sum f_i}$
Substituting the values from the table:
$\bar{x} = \frac{3210}{30} = 107$
The variance is determined using the formula [By the computational formula for variance]:
$\sigma^2 = \frac{1}{N} \sum f_i x_i^2 - (\bar{x})^2$, where $N = \sum f_i$.
$\sigma^2 = \frac{411775}{30} - (107)^2$
$\sigma^2 = 13725.833 - 11449$
$\sigma^2 = 2276.833$
Final Solution: The Mean is $107$ and the Variance is $2276.833$.
Solution:
Given the frequency distribution, we first identify the mid-points ($x_i$) and select an assumed mean ($A$). The data is structured as follows:
| Classes | Frequency ($f_i$) | Mid-point ($x_i$) | $d_i = x_i - A$ | $f_i d_i$ | $f_i d_i^2$ |
|---|---|---|---|---|---|
| 60-64 | 2 | 62 | -10 | -20 | 200 |
| 65-69 | 4 | 67 | -5 | -20 | 100 |
| 70-74 | 7 | 72 | 0 | 0 | 0 |
| 75-79 | 8 | 77 | 5 | 40 | 200 |
| 80-84 | 9 | 82 | 10 | 90 | 900 |
| Total | $\sum f_i = 30$ | - | - | $\sum f_i d_i = 90$ | $\sum f_i d_i^2 = 1400$ |
Let the assumed mean $A = 72$ [Choosing the mid-point of the central class with the highest frequency for computational efficiency].
Using the short-cut formula for the mean: $\bar{x} = A + \frac{\sum f_i d_i}{\sum f_i}$ [By the Property of Arithmetic Mean under linear transformation].
$\bar{x} = 72 + \frac{90}{30}$
$\bar{x} = 72 + 3 = 75$
Using the formula for standard deviation by short-cut method: $\sigma = \sqrt{\frac{\sum f_i d_i^2}{N} - \left( \frac{\sum f_i d_i}{N} \right)^2}$ [By Variance identity $\text{Var}(X) = E[X^2] - (E[X])^2$].
Substitute the values from the table where $N = \sum f_i = 30$:
$\sigma = \sqrt{\frac{1400}{30} - \left( \frac{90}{30} \right)^2}$
$\sigma = \sqrt{46.6667 - (3)^2}$
$\sigma = \sqrt{46.6667 - 9}$
$\sigma = \sqrt{37.6667} \approx 6.137$
Final Solution: Mean ($\bar{x}$) = 75; Standard Deviation ($\sigma$) $\approx$ 6.137
Solution:
Given data set: $x_i = \{38, 70, 48, 40, 42, 55, 63, 46, 54, 44\}$
Number of observations ($n$) = $10$.
The arithmetic mean is defined as $\bar{x} = \frac{1}{n} \sum_{i=1}^{n} x_i$. [Definition of Arithmetic Mean for Ungrouped Data]
Summation: $38 + 70 + 48 + 40 + 42 + 55 + 63 + 46 + 54 + 44 = 500$.
$\bar{x} = \frac{500}{10} = 50$.
We calculate $|x_i - 50|$ for each observation to find the distance from the mean. [Property of Absolute Deviation]
| $x_i$ | $|x_i - 50|$ |
|---|---|
| 38 | $|38 - 50| = 12$ |
| 70 | $|70 - 50| = 20$ |
| 48 | $|48 - 50| = 2$ |
| 40 | $|40 - 50| = 10$ |
| 42 | $|42 - 50| = 8$ |
| 55 | $|55 - 50| = 5$ |
| 63 | $|63 - 50| = 13$ |
| 46 | $|46 - 50| = 4$ |
| 54 | $|54 - 50| = 4$ |
| 44 | $|44 - 50| = 6$ |
The formula for Mean Deviation about the mean is: $\text{M.D.}(\bar{x}) = \frac{1}{n} \sum_{i=1}^{n} |x_i - \bar{x}|$. [Statistical Definition of Mean Deviation]
Sum of absolute deviations = $12 + 20 + 2 + 10 + 8 + 5 + 13 + 4 + 4 + 6 = 84$.
$\text{M.D.}(\bar{x}) = \frac{84}{10} = 8.4$.
Final Solution: The mean deviation about the mean for the given data is 8.4.
Solution:
The set of the first $n$ natural numbers is defined as $S = \{1, 2, 3, \dots, n\}$.
The mean ($\bar{x}$) is defined as the sum of all observations divided by the number of observations ($n$):
$\bar{x} = \frac{1}{n} \sum_{i=1}^{n} i$
Using the arithmetic progression summation formula [$\sum_{i=1}^{n} i = \frac{n(n+1)}{2}$]:
$\bar{x} = \frac{1}{n} \cdot \frac{n(n+1)}{2} = \frac{n+1}{2}$
The variance ($\sigma^2$) of a discrete data set is given by the formula:
$\sigma^2 = \frac{1}{n} \sum_{i=1}^{n} (x_i - \bar{x})^2$
Alternatively, using the computational formula [By algebraic expansion]:
$\sigma^2 = \left( \frac{1}{n} \sum_{i=1}^{n} x_i^2 \right) - (\bar{x})^2$
We require the sum of the squares of the first $n$ natural numbers [Standard Power Sum Formula]:
$\sum_{i=1}^{n} i^2 = \frac{n(n+1)(2n+1)}{6}$
Substituting the values from Step 1 and Step 3 into the computational variance formula:
$\sigma^2 = \frac{1}{n} \left[ \frac{n(n+1)(2n+1)}{6} \right] - \left( \frac{n+1}{2} \right)^2$
$\sigma^2 = \frac{(n+1)(2n+1)}{6} - \frac{(n+1)^2}{4}$
Factoring out $\frac{n+1}{2}$:
$\sigma^2 = \frac{n+1}{2} \left[ \frac{2n+1}{3} - \frac{n+1}{2} \right]$
Finding the common denominator within the brackets:
$\sigma^2 = \frac{n+1}{2} \left[ \frac{2(2n+1) - 3(n+1)}{6} \right]$
$\sigma^2 = \frac{n+1}{2} \left[ \frac{4n + 2 - 3n - 3}{6} \right]$
$\sigma^2 = \frac{n+1}{2} \left[ \frac{n - 1}{6} \right]$
$\sigma^2 = \frac{(n+1)(n-1)}{12} = \frac{n^2 - 1}{12}$
Final Solution: The mean is $\frac{n+1}{2}$ and the variance is $\frac{n^2-1}{12}$.
Solution:
The first 10 multiples of 3 form an arithmetic progression. Let the dataset be denoted by $X = \{x_1, x_2, ..., x_{10}\}$.
The values are: $3, 6, 9, 12, 15, 18, 21, 24, 27, 30$.
Here, the number of observations $n = 10$.
The mean is defined as the sum of observations divided by the number of observations [By Definition of Arithmetic Mean]:
$\bar{x} = \frac{\sum_{i=1}^{10} x_i}{n} = \frac{3+6+9+12+15+18+21+24+27+30}{10}$
Using the formula for the sum of an arithmetic series $S_n = \frac{n}{2}(a + l)$, where $a=3$ and $l=30$:
$\sum x_i = \frac{10}{2}(3 + 30) = 5 \times 33 = 165$
$\bar{x} = \frac{165}{10} = 16.5$
The variance is calculated using the formula [Per the Statistical Definition of Variance]:
$\sigma^2 = \frac{1}{n} \sum_{i=1}^{10} (x_i - \bar{x})^2$
Alternatively, the computational formula is $\sigma^2 = \frac{1}{n} \sum x_i^2 - (\bar{x})^2$.
| $x_i$ | $x_i^2$ |
|---|---|
| 3 | 9 |
| 6 | 36 |
| 9 | 81 |
| 12 | 144 |
| 15 | 225 |
| 18 | 324 |
| 21 | 441 |
| 24 | 576 |
| 27 | 729 |
| 30 | 900 |
| Total | 3465 |
Now, calculate the mean of the squares:
$\frac{\sum x_i^2}{n} = \frac{3465}{10} = 346.5$
$\sigma^2 = 346.5 - (16.5)^2$
Calculate $(16.5)^2 = 272.25$
$\sigma^2 = 346.5 - 272.25 = 74.25$
Final Solution: The mean of the first 10 multiples of 3 is $16.5$, and the variance is $74.25$.
Solution:
To determine the median, the given raw data must be arranged in ascending order. Let the given set be $X = \{36, 72, 46, 42, 60, 45, 53, 46, 51, 49\}$.
Ordered sequence: $36, 42, 45, 46, 46, 49, 51, 53, 60, 72$
The total number of observations, $n = 10$. [Since $n$ is even, we use the median formula for even-numbered datasets].
The median of an even set of observations is the average of the $(\frac{n}{2})^{th}$ and $(\frac{n}{2} + 1)^{th}$ terms.
$M = \frac{46 + 49}{2} = \frac{95}{2} = 47.5$
We now compute the absolute deviation of each observation $x_i$ from the median $M = 47.5$.
| $x_i$ | $|x_i - 47.5|$ |
|---|---|
| 36 | $|36 - 47.5| = 11.5$ |
| 42 | $|42 - 47.5| = 5.5$ |
| 45 | $|45 - 47.5| = 2.5$ |
| 46 | $|46 - 47.5| = 1.5$ |
| 46 | $|46 - 47.5| = 1.5$ |
| 49 | $|49 - 47.5| = 1.5$ |
| 51 | $|51 - 47.5| = 3.5$ |
| 53 | $|53 - 47.5| = 5.5$ |
| 60 | $|60 - 47.5| = 12.5$ |
| 72 | $|72 - 47.5| = 24.5$ |
Summing the values calculated in Step 3:
$\sum_{i=1}^{10} |x_i - M| = 11.5 + 5.5 + 2.5 + 1.5 + 1.5 + 1.5 + 3.5 + 5.5 + 12.5 + 24.5$
$\sum_{i=1}^{10} |x_i - M| = 70.0$
The Mean Deviation about the Median ($MD_M$) is defined by the formula: [Per the statistical definition of mean deviation]
$MD_M = \frac{\sum_{i=1}^{n} |x_i - M|}{n}$
$MD_M = \frac{70}{10} = 7$
Final Solution: The Mean Deviation about the median is 7.
Solution:
The provided data consists of class intervals and their corresponding frequencies ($f_i$). We represent the data in tabular form to facilitate calculations:
| Class Interval | Frequency ($f_i$) | Midpoint ($x_i$) | $f_i x_i$ | $x_i^2$ | $f_i x_i^2$ |
|---|---|---|---|---|---|
| 16–20 | 5 | 18 | 90 | 324 | 1620 |
| 21–25 | 6 | 23 | 138 | 529 | 3174 |
| 26–30 | 12 | 28 | 336 | 784 | 9408 |
| 31–35 | 14 | 33 | 462 | 1089 | 15246 |
| 36–40 | 26 | 38 | 988 | 1444 | 37544 |
| 41–45 | 12 | 43 | 516 | 1849 | 22188 |
| 46–50 | 16 | 48 | 768 | 2304 | 36864 |
| Total | $\sum f_i = 91$ | - | $\sum f_i x_i = 3298$ | - | $\sum f_i x_i^2 = 126044$ |
The formula for the mean of grouped data is given by: $\bar{x} = \frac{\sum f_i x_i}{\sum f_i}$ [Definition of Arithmetic Mean for Grouped Data]
Substituting the values from the table:
$\bar{x} = \frac{3298}{91} \approx 36.24$The formula for variance is: $\sigma^2 = \frac{1}{N} \sum f_i(x_i - \bar{x})^2$ or equivalently, $\sigma^2 = \frac{\sum f_i x_i^2}{N} - (\bar{x})^2$ [Statistical Formula for Variance]
Using the values $\sum f_i x_i^2 = 126044$, $N = 91$, and $\bar{x} = 36.24175...$:
$\sigma^2 = \frac{126044}{91} - (36.24175)^2$Performing the division:
$\frac{126044}{91} \approx 1385.0989$Calculating the square of the mean:
$(36.24175)^2 \approx 1313.4646$Final subtraction:
$\sigma^2 = 1385.0989 - 1313.4646 = 71.6343$Final Solution: The mean ($\bar{x}$) is approximately $36.24$ and the variance ($\sigma^2$) is approximately $71.63$.
Solution:
To find the mean and variance for a grouped frequency distribution, we first identify the mid-point ($x_i$) for each class interval using the formula $x_i = \frac{\text{Lower Limit} + \text{Upper Limit}}{2}$.
| Class Interval | Frequency ($f_i$) | Mid-point ($x_i$) | $f_ix_i$ | $x_i^2$ | $f_ix_i^2$ |
|---|---|---|---|---|---|
| 0-10 | 5 | 5 | 25 | 25 | 125 |
| 10-20 | 8 | 15 | 120 | 225 | 1800 |
| 20-30 | 15 | 25 | 375 | 625 | 9375 |
| 30-40 | 16 | 35 | 560 | 1225 | 19600 |
| 40-50 | 6 | 45 | 270 | 2025 | 12150 |
| Total | $N = 50$ | - | $\sum f_ix_i = 1350$ | - | $\sum f_ix_i^2 = 43050$ |
The mean is calculated using the formula: $\bar{x} = \frac{\sum f_ix_i}{N}$ [Per the definition of arithmetic mean for grouped data].
$\bar{x} = \frac{1350}{50} = 27$
The variance for a grouped frequency distribution is calculated using the formula: $\sigma^2 = \frac{1}{N} \sum f_i(x_i - \bar{x})^2$ or the computational formula $\sigma^2 = \frac{1}{N} \sum f_ix_i^2 - (\bar{x})^2$.
Substituting the calculated values:
$\sigma^2 = \frac{43050}{50} - (27)^2$ [By the Algebraic Variance Identity]
$\sigma^2 = 861 - 729$
$\sigma^2 = 132$
Final Solution: The Mean ($\bar{x}$) is $27$ and the Variance ($\sigma^2$) is $132$.
Solution:
To find the mean deviation about the median, we first arrange the given data and calculate the cumulative frequencies ($cf$).
| $x_i$ | $f_i$ | $cf$ |
|---|---|---|
| 15 | 3 | 3 |
| 21 | 5 | 8 |
| 27 | 6 | 14 |
| 30 | 7 | 21 |
| 35 | 8 | 29 |
| Total | $N = 29$ | - |
The total number of observations is $N = 29$, which is odd. The median is the value of the $\left(\frac{N+1}{2}\right)^{th}$ observation.
Position $= \frac{29+1}{2} = 15^{th}$ observation. [Per the definition of median for discrete frequency distributions]
Looking at the cumulative frequency column, the $15^{th}$ observation lies in the row where $cf = 21$. Thus, the Median ($M$) = 30.
We calculate the absolute deviation $|x_i - M|$ for each observation and multiply by its corresponding frequency $f_i$.
| $x_i$ | $f_i$ | $|x_i - 30|$ | $f_i |x_i - 30|$ |
|---|---|---|---|
| 15 | 3 | 15 | 45 |
| 21 | 5 | 9 | 45 |
| 27 | 6 | 3 | 18 |
| 30 | 7 | 0 | 0 |
| 35 | 8 | 5 | 40 |
| Sum | 29 | - | 148 |
The formula for Mean Deviation about the Median ($MD_{med}$) is given by: [As per statistical measure of dispersion formulas]
$MD_{med} = \frac{1}{N} \sum_{i=1}^{n} f_i |x_i - M|$
$MD_{med} = \frac{148}{29}$
$MD_{med} \approx 5.103$
Final Solution: The mean deviation about the median is $\frac{148}{29} \approx 5.103$.
Solution:
To find the mean deviation about the median, we first organize the data to calculate the cumulative frequency ($cf$).
| $x_i$ | $f_i$ | $cf$ |
|---|---|---|
| 5 | 8 | 8 |
| 7 | 6 | 14 |
| 9 | 2 | 16 |
| 10 | 2 | 18 |
| 12 | 2 | 20 |
| 15 | 6 | 26 |
| Total | $N = 26$ | - |
The total number of observations $N = 26$ (which is even). The median is the mean of the $(\frac{N}{2})^{th}$ and $(\frac{N}{2} + 1)^{th}$ observation.
$\frac{N}{2} = \frac{26}{2} = 13$
$\frac{N}{2} + 1 = 14$
Looking at the cumulative frequency table, the $13^{th}$ observation corresponds to $x = 7$ (since $8 < 13 \le 14$), and the $14^{th}$ observation corresponds to $x = 7$.
$M = \frac{7 + 7}{2} = 7$ [By definition of median for discrete frequency distribution]
We calculate $|x_i - M|$ for each $x_i$ and multiply by the corresponding frequency $f_i$.
| $x_i$ | $f_i$ | $|x_i - 7|$ | $f_i |x_i - 7|$ |
|---|---|---|---|
| 5 | 8 | 2 | 16 |
| 7 | 6 | 0 | 0 |
| 9 | 2 | 2 | 4 |
| 10 | 2 | 3 | 6 |
| 12 | 2 | 5 | 10 |
| 15 | 6 | 8 | 48 |
| Total | 26 | - | 84 |
The formula for Mean Deviation ($M.D.$) about the median is:
$M.D.(M) = \frac{1}{N} \sum_{i=1}^{n} f_i |x_i - M|$
$M.D.(M) = \frac{84}{26}$
$M.D.(M) = \frac{42}{13} \approx 3.23$
Final Solution: The mean deviation about the median is $\frac{42}{13}$ or approximately $3.23$.
Solution:
Given six observations, let them be denoted by $x_1, x_2, x_3, x_4, x_5, x_6$. The problem provides the initial mean ($\bar{x}$) and the initial standard deviation ($\sigma$):
If each observation $x_i$ is multiplied by a constant $k$, the new observations $y_i$ are defined as $y_i = kx_i$. Per the linearity property of the arithmetic mean: $\bar{y} = \frac{1}{n} \sum y_i = \frac{1}{n} \sum (kx_i) = k \left( \frac{1}{n} \sum x_i \right) = k\bar{x}$.
Given $k = 3$ and $\bar{x} = 8$:
$\bar{y} = 3 \times 8 = 24$
The standard deviation is defined as $\sigma = \sqrt{\frac{\sum (x_i - \bar{x})^2}{n}}$. For the new set of observations $y_i = kx_i$, the new mean is $\bar{y} = k\bar{x}$. The new standard deviation ($\sigma'$) is:
$\sigma' = \sqrt{\frac{\sum (y_i - \bar{y})^2}{n}}$
Substituting $y_i = kx_i$ and $\bar{y} = k\bar{x}$:
$\sigma' = \sqrt{\frac{\sum (kx_i - k\bar{x})^2}{n}} = \sqrt{\frac{\sum k^2(x_i - \bar{x})^2}{n}}$
Extracting the constant $k^2$ from the summation [Per the properties of variance]:
$\sigma' = \sqrt{k^2 \cdot \frac{\sum (x_i - \bar{x})^2}{n}} = |k| \sigma$
Using $k = 3$ and the initial standard deviation $\sigma = 4$:
New Standard Deviation ($\sigma'$) = $|3| \times 4 = 12$
Final Solution: The new mean is 24 and the new standard deviation is 12.
Solution:
Given data set: $x_i = \{4, 7, 8, 9, 10, 12, 13, 17\}$. The number of observations $n = 8$.
The arithmetic mean is defined as $\bar{x} = \frac{1}{n} \sum_{i=1}^{n} x_i$.
Summation: $\sum x_i = 4 + 7 + 8 + 9 + 10 + 12 + 13 + 17 = 80$.
Calculation: $\bar{x} = \frac{80}{8} = 10$. [By the definition of Arithmetic Mean for ungrouped data].
We compute the absolute deviation for each observation $x_i$ from $\bar{x} = 10$.
| $x_i$ | $|x_i - 10|$ |
|---|---|
| 4 | 6 |
| 7 | 3 |
| 8 | 2 |
| 9 | 1 |
| 10 | 0 |
| 12 | 2 |
| 13 | 3 |
| 17 | 7 |
The formula for Mean Deviation is $M.D.(\bar{x}) = \frac{1}{n} \sum_{i=1}^{n} |x_i - \bar{x}|$. [By the definition of Mean Deviation].
Sum of absolute deviations: $\sum |x_i - \bar{x}| = 6 + 3 + 2 + 1 + 0 + 2 + 3 + 7 = 24$.
Calculation: $M.D.(\bar{x}) = \frac{24}{8} = 3$.
Final Solution: The Mean Deviation about the mean for the given data is 3.