
Your Worksheet is Ready
CBSE - Class 11 Physics Kinetic Theory Worksheet
Figure 13.8 shows plot of $frac{PV}{T}$ versus $P$ for $1.00 \times 10^{-3}$ kg of oxygen gas at two different temperatures. (c) What is the value of $frac{PV}{T}$ where the curves meet on the y-axis?

Figure 13.8 shows plot of $frac{PV}{T}$ versus $P$ for $1.00 \times 10^{-3}$ kg of oxygen gas at two different temperatures. (b) Which is true: $T_1 > T_2$ or $T_1 < T_2$?

Figure 13.8 shows plot of $frac{PV}{T}$ versus $P$ for $1.00 \times 10^{-3}$ kg of oxygen gas at two different temperatures. (d) If we obtained similar plots for $1.00 \times 10^{-3}$ kg of hydrogen, would we get the same value of $frac{PV}{T}$ at the point where the curves meet on the y-axis? If not, what mass of hydrogen yields the same value of $frac{PV}{T}$ (for low pressure high temperature region of the plot) ? (Molecular mass of $H_2$ = 2.02 u, of $O_2$ = 32.0 u, $R = 8.31$ J $mol^{-1} K^{-1}$.)
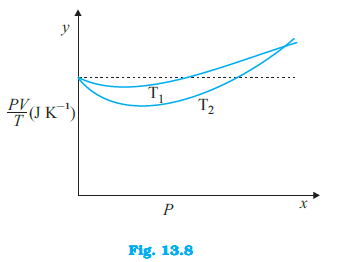
Figure 13.8 shows plot of $frac{PV}{T}$ versus $P$ for $1.00 \times 10^{-3}$ kg of oxygen gas at two different temperatures. (a) What does the dotted plot signify?

Worksheet Answers
