
Your Worksheet is Ready
CBSE - Class 9 Science Motion Worksheet
Fig 7.10 shows the distance-time graph of three objects A,B and C. Study the graph and answer the following questions:

(c) How far has C travelled when B passes A?
The speed-time graph for a car is shown is Fig. 7.11.
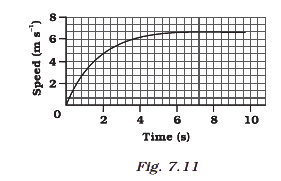
(b) Which part of the graph represents uniform motion of the car?
Fig 7.10 shows the distance-time graph of three objects A,B and C. Study the graph and answer the following questions:

(b) Are all three ever at the same point on the road?
Fig 7.10 shows the distance-time graph of three objects A,B and C. Study the graph and answer the following questions:

(a) Which of the three is travelling the fastest?
The speed-time graph for a car is shown is Fig. 7.11.

(a) Find how far does the car travel in the first 4 seconds. Shade the area on the graph that represents the distance travelled by the car during the period.
Fig 7.10 shows the distance-time graph of three objects A,B and C. Study the graph and answer the following questions:
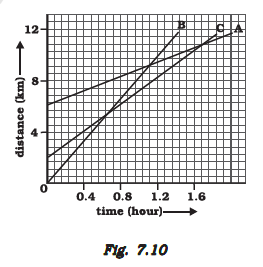
(d) How far has B travelled by the time it passes C?
Worksheet Answers
