
Your Worksheet is Ready
CBSE - Class 9 Mathematics Statistics Worksheet
Given below are the seats won by different political parties in the polling outcome of a state assembly elections:

(ii) Which political party won the maximum number of seats?
The following table gives the life times of 400 neon lamps:

(i) Represent the given information with the help of a histogram.
100 surnames were randomly picked up from a local telephone directory and a frequency distribution of the number of letters in the English alphabet in the surnames was found as follows:

(i) Draw a histogram to depict the given information.
The length of 40 leaves of a plant are measured correct to one millimetre, and the obtained data is represented in the following table:

(ii) Is there any other suitable graphical representation for the same data?
A random survey of the number of children of various age groups playing in a park was found as follows:
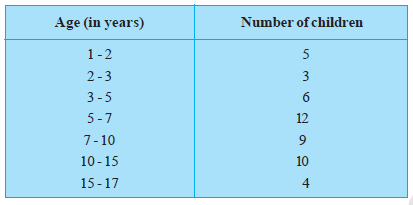
Draw a histogram to represent the data above.
The following table gives the distribution of students of two sections according to the marks obtained by them:
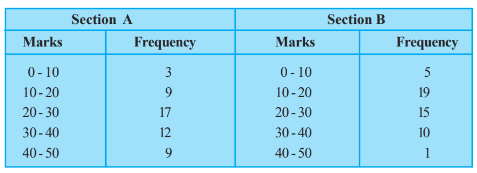
Represent the marks of the students of both the sections on the same graph by two frequency polygons. From the two polygons compare the performance of the two sections.
The runs scored by two teams A and B on the first 60 balls in a cricket match are given below:
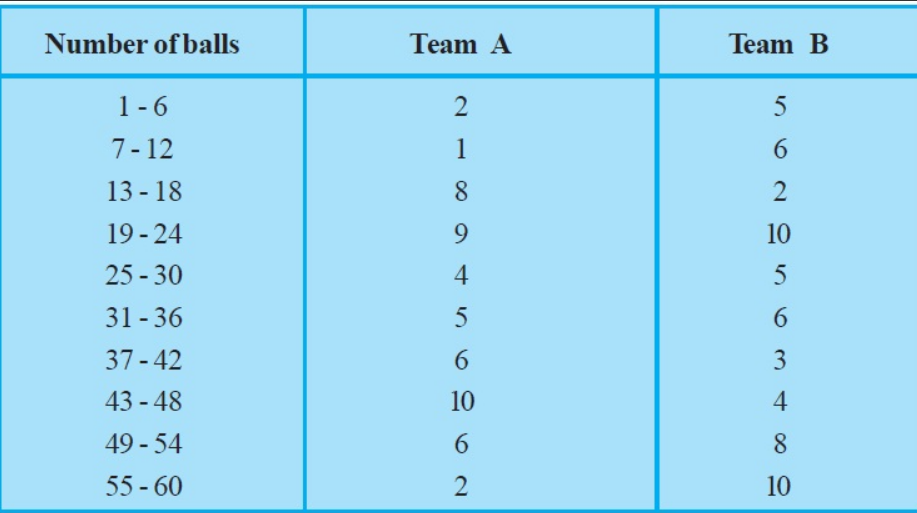
Represent the data of both the teams on the same graph by frequency polygons. [Hint : First make the class intervals continuous.]
100 surnames were randomly picked up from a local telephone directory and a frequency distribution of the number of letters in the English alphabet in the surnames was found as follows:
(ii) Write the class interval in which the maximum number of surnames lie.
The following data on the number of girls (to the nearest ten) per thousand boys in different sections of Indian society is given below.

(i) Represent the information above by a bar graph.
A survey conducted by an organisation for the cause of illness and death among the women between the ages $15 - 44$ (in years) worldwide, found the following figures (in %)

(i) Represent the information given above graphically.
The length of 40 leaves of a plant are measured correct to one millimetre, and the obtained data is represented in the following table:
(i) Draw a histogram to represent the given data. [Hint: First make the class intervals continuous]
A survey conducted by an organisation for the cause of illness and death among the women between the ages $15 - 44$ (in years) worldwide, found the following figures (in %):
(iii) Try to find out, with the help of your teacher, any two factors which play a major role in the cause in (ii) above being the major cause.
A survey conducted by an organisation for the cause of illness and death among the women between the ages $15 - 44$ (in years) worldwide, found the following figures (in %):
(ii) Which condition is the major cause of women’s ill health and death worldwide?
Given below are the seats won by different political parties in the polling outcome of a state assembly elections:
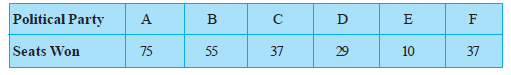
(i) Draw a bar graph to represent the polling results.
The following data on the number of girls (to the nearest ten) per thousand boys in different sections of Indian society is given below.
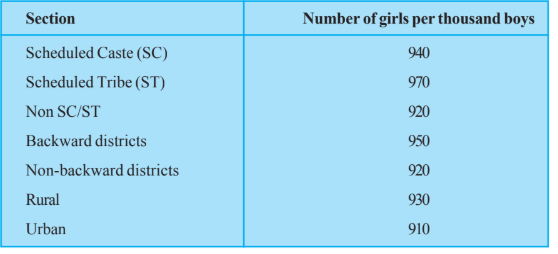
(ii) In the classroom discuss what conclusions can be arrived at from the graph.
The following table gives the life times of 400 neon lamps:
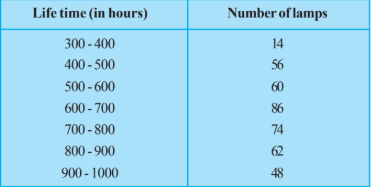
(ii) How many lamps have a life time of more than 700 hours?
The length of 40 leaves of a plant are measured correct to one millimetre, and the obtained data is represented in the following table:
(iii) Is it correct to conclude that the maximum number of leaves are 153 mm long? Why?
Worksheet Answers
