UrbanPro
true

Learn Microsoft Excel Training from the Best Tutors

  • Affordable fees
  • 1-1 or Group class
  • Flexible Timings
  • Verified Tutors

Sparklines

Saburudeen MA
23/05/2017 0 0

Sometimes you may want to analyse and view trends in your data without creating an entire chart. Sparklines are miniature charts that fit into a single cell.

A Sparkline is a tiny chart in a worksheet cell that provides a visual representation of data. Use sparklines to show trends in a series of values, such as seasonal increases or decreases, economic cycles, or to highlight maximum and minimum values. Position a Sparkline near its data for greatest impact.

Sparkline can display a trend based on adjacent data in a clear and compact graphical representation. Although it's not mandatory for a Sparkline cell to be directly next to its underlying data, it is a good practice.

We can quickly see the relationship between a Sparkline and its underlying data, and when your data changes you can see the change in the Sparkline immediately. In addition to creating a single Sparkline for a row or column of data, you can create several sparklines at the same time by selecting multiple cells that correspond to underlying data,

Sparklines have certain advantages over charts. For example, let's say you have 1,000 rows of data. A traditional chart would have 1,000 data series to represent all of the rows, making relevant data difficult to find. But if you placed a Sparkline on each row, it will be right next to its source data, making it easy to see relationships and trends for multiple data series at the same time.


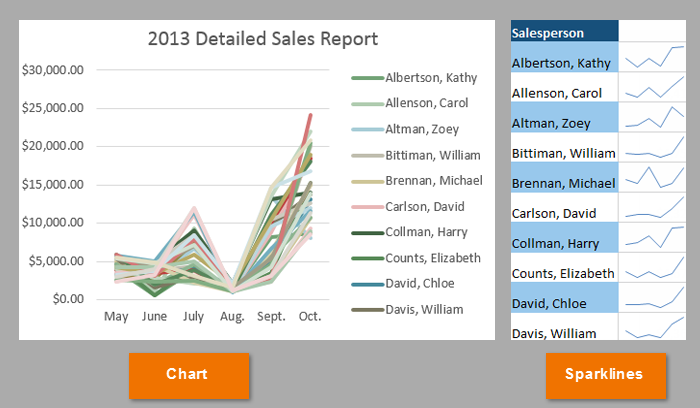
In the image below, the chart is extremely cluttered and difficult to follow, but the sparklines allow you to clearly follow each salesperson's data.

img


Types Of Sparklines:

There are three different types of sparklines:

  • Line that represents the relative value of the selected worksheet data
  • Column where the selected worksheet data is represented by tiny columns
  • Win/Loss where the selected worksheet data appears as a win/loss chart; wins are represented by blue squares that appear above red squares (representing the losses)

Create a Sparkline:

  1. Select an empty cell or group of empty cells in which you want to insert one or more sparklines.
  2. On the Insert tab, in the Sparklines group, click the type of Sparkline that you want to create: Line, Column, or Win/Loss.
  3. Select the range of the cells that contain the data on which you want to base the Sparklines.
  4. The Sparkline will appear in the specified cell.
0 Dislike
Follow 0

Please Enter a comment

Submit

Other Lessons for You

Microsoft Excel Functions Examples
Functions Discover how functions in Excel help you save time. If you are new to functions in Excel, we recommend you to read our introduction to Formulas and Functions first. 1 Count and Sum: The most...

How to Remove Duplicates from your data
Larger data sets tend to have duplicate content. You may have a list of multiple contacts in a organization and only want to see the number of organization you have or you have multiple rows of same type...

Pivot Tables In Excel
i. Pivot Tables: A pivot table is essentially a dynamic summary report generated from a database. The database can reside in a worksheet (in the form of a table) or in an external data file. A pivot table...

Computer Basic.
If you know the design of table. Then go to second steps: 1) If you type a long data in a single cell or some other data in next cell, problem arise that the first cell data is not showing clear. Then...

R programming language
R is a programming language and software environment for statistical computing and graphics supported by the R Foundation for Statistical Computing. The R language is widely used among statisticians and...

Looking for Microsoft Excel Training classes?

Learn from Best Tutors on UrbanPro.

Are you a Tutor or Training Institute?

Join UrbanPro Today to find students near you
X

Looking for Microsoft Excel Training Classes?

The best tutors for Microsoft Excel Training Classes are on UrbanPro

  • Select the best Tutor
  • Book & Attend a Free Demo
  • Pay and start Learning

Learn Microsoft Excel Training with the Best Tutors

The best Tutors for Microsoft Excel Training Classes are on UrbanPro

This website uses cookies

We use cookies to improve user experience. Choose what cookies you allow us to use. You can read more about our Cookie Policy in our Privacy Policy

Accept All
Decline All

UrbanPro.com is India's largest network of most trusted tutors and institutes. Over 55 lakh students rely on UrbanPro.com, to fulfill their learning requirements across 1,000+ categories. Using UrbanPro.com, parents, and students can compare multiple Tutors and Institutes and choose the one that best suits their requirements. More than 7.5 lakh verified Tutors and Institutes are helping millions of students every day and growing their tutoring business on UrbanPro.com. Whether you are looking for a tutor to learn mathematics, a German language trainer to brush up your German language skills or an institute to upgrade your IT skills, we have got the best selection of Tutors and Training Institutes for you. Read more